- Brushing is the idea of being able to select, with a box or lasso like tool, a subset of the points in a one- or two- dimensional space.
- Linking is when data points are connected. In the
context of brushing, this allows a user to explore high dimensional
spaces by selecting collections of points in one dimension and
determining where they lie in another dimension. - Staging is a storytelling tool, allowing the author to
reveal or highlight parts of a figure in sequence. The highlighting can
take the form of Brushing and Linking as above. - Alberto Pepe, Alyssa Goodman, August
Muench, Merce Crosas, Christopher Erdmann. How Do Astronomers Share
Data? Reliability and Persistence of Datasets Linked in AAS Publications
and a Qualitative Study of Data Practices among US Astronomers. PLOS One 9, e104798 Public Library of Science ({ - ), 2014. Link
- Alyssa Goodman, Alberto Pepe, Alexander
W. Blocker, Christine L. Borgman, Kyle Cranmer, Merce Crosas, Rosanne Di
Stefano, Yolanda Gil, Paul Groth, Margaret Hedstrom, David W. Hogg,
Vinay Kashyap, Ashish Mahabal, Aneta Siemiginowska, Aleksandra
Slavkovic. Ten Simple Rules for the Care and Feeding of Scientific Data.
PLoS Computational Biology 10, e1003542 Public Library of Science (PLoS), 2014. Link - Alyssa Goodman, Patricia Udomprasert, Wong Curtis. Galileo’s New Order. (2013). Link
- W. L.
Diaz-Merced, R. M. Candey, N. Brickhouse, M. Schneps, J. C. Mannone, S.
Brewster, K. Kolenberg. Sonification of Astronomical Data. 285, 133-136 In IAU Symposium. (2012). Link - A. A.
Goodman, E. W. Rosolowsky, M. A. Borkin, J. B. Foster, M. Halle, J.
Kauffmann, J. E. Pineda. A role for self-gravity at multiple length
scales in the process of star formation. Nature 457, 63-66 (2009). Link - M. E. Putman, J. E. G. Peek, F. Heitsch. The Accretion of Fuel at the Disk-Halo Interface. 56, 267-274 In EAS Publications Series. (2012). Link
- Michael J. Kurtz, Johan Bollen. Usage bibliometrics. Annual Review of Information Science and Technology 44, 1–64 Wiley-Blackwell, 2010. Link
The "Paper" of the Future
3
A 5-minute video demonstration of this paper is available at this YouTube link.
Much more than text is used to commuicate in Science. Figures, which include images, diagrams, graphs, charts, and more, have enriched scholarly articles since the time of Galileo, and ever-growing volumes of data underpin most scientific papers. When scientists communicate face-to-face, as in talks or small discussions, these figures are often the focus of the conversation. In the best discussions, scientists have the ability to manipulate the figures, and to access underlying data, in real-time, so as to test out various what-if scenarios, and to explain findings more clearly. This short article explains—and shows with demonstrations—how scholarly "papers" can morph into long-lasting rich records of scientific discourse, enriched with deep data and code linkages, interactive figures, audio, video, and commenting.
1 Preamble
A variety of research on human cognition demonstrates that humans learn and communicate best when more than one processing system (e.g. visual, auditory, touch) is used. And, related research also shows that, no matter how technical the material, most humans also retain and process information best when they can put a narrative "story" to it. So, when considering the future of scholarly communication, we should be careful not to do blithely away with the linear narrative format that articles and books have followed for centuries: instead, we should enrich it.Much more than text is used to commuicate in Science. Figures, which include images, diagrams, graphs, charts, and more, have enriched scholarly articles since the time of Galileo, and ever-growing volumes of data underpin most scientific papers. When scientists communicate face-to-face, as in talks or small discussions, these figures are often the focus of the conversation. In the best discussions, scientists have the ability to manipulate the figures, and to access underlying data, in real-time, so as to test out various what-if scenarios, and to explain findings more clearly. This short article explains—and shows with demonstrations—how scholarly "papers" can morph into long-lasting rich records of scientific discourse, enriched with deep data and code linkages, interactive figures, audio, video, and commenting.
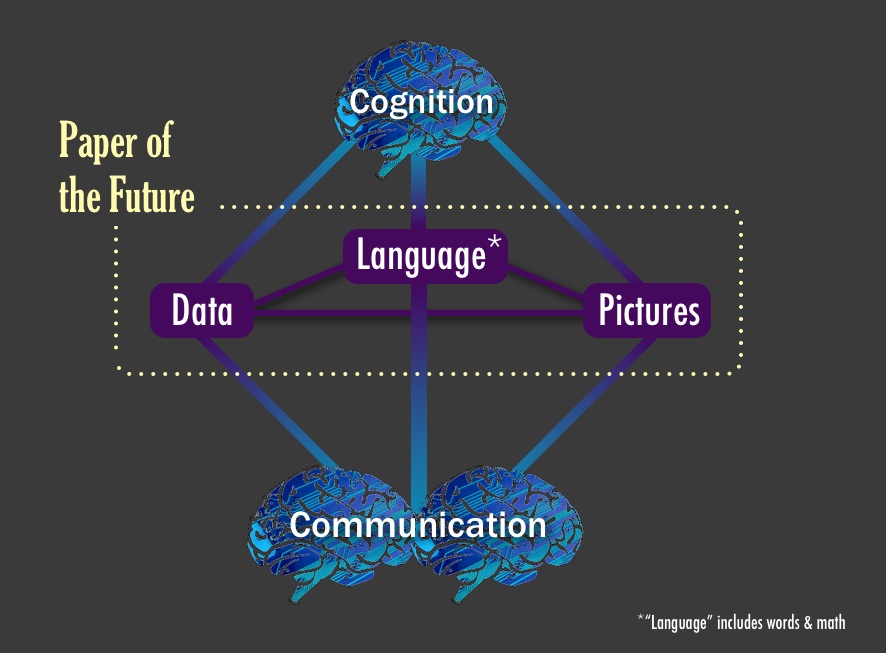
The Paper of the Future should include seamless linkages amongst data, pictures, and language,
where "language" includes both words and math. When an individual
attempts to understand each of these kinds of information, different
cognitive functions are utilized: communication is inefficient if the
channel is restricted primarily to language, without easy
interconnection to data and pictures.
2 Collaborative Authoring
This article has been written using the Authorea collaborative online authoring platform. Authorea is one of a growing number of services that allow authors, especially in the Sciences, to move collaborative writing from a system of emailing drafts created in desktop software (like LaTeX editors or Microsoft Word) amongst co-authors and editors to online, real-time, collaborative, platforms.Most scholars today are very familiar with simple collaborative writing tools like Google Docs. Authorea and its ilk can be thought of as more sophisticated versions of Google Docs, in that they include the ability to include equations, figures, limited interactivity, and that they offer better version control. Table 1, below, compares key features of several collaborative technical writing platforms, including Authorea, writeLaTeX, and shareLaTeX, along with two more general purpose platforms, Google Docs and Microsoft Word.
| ShareLatex | Authorea | Overleaf (WriteLaTeX) | Google Docs | Microsoft Word | |
|---|---|---|---|---|---|
| Version Control | full (internal) | full (git) | full (internal) | full (Google) | None |
| Simultaneous Editing | full | by section | full | full | Sharepoint |
| Offline Editing | Dropbox | browser/git | browser/git | Google Drive | native |
| Ease of Use | ★★★ | ★★ | ★★★ | ★★★★★ | ★★★★ |
| Math Support | Latex | Latex / others | Latex | Limited GUI | GUI |
| Output Formats | PDF, HTML | Word, PDF | |||
| Commenting | Latex | By section or text | todonotes.sty | By section | Track Changes |
| Citations | bibtex | integrated | bibtex | in add-ons | integrated |
| Interactivity | movie15.sty | full javascript | movie15.sty | in add-ons | None? |
3 Linking Data
Traditionally, the only citations within scholarly writing are to other scholarly writing. In some Journals today, URLs are allowed as footnotes, but not typically as full-fledged citations on-par with journal articles. This is for good reason. URLs are notoriously ephemeral, and URLs pointing to data have half-lives of less than a decade (Pepe 2014).A great deal of public scholarly worrying (and writing) about how to offer robust, long-lived, links to data has gone on over especially the past decade (see Goodman et al. (2014), and references therein). Instead of reviewing the concomitant literature, we here offer just the following practical advice. If a dataset can be assigned a long-term identifier that moves with data as it moves from one computer system to another, then such an identifier should be sought, and it should be cited in scholarly articles. One modern version of such "persistent" identifiers are "DOIs" which use the so-called "Handle" system. Details on how this system works are here: http://www.doi.org/factsheets/DOIHandle.html.
There are currently several systems that will issue DOIs when data are uploaded to a repository, including Zenodo, figshare, and The Dataverse. Each system presently has different various advantages and disadvantages, concerning ease-of-use, richness of metadata, and formats accepted. Authors and publishers can, and should, use any service that issues a robust DOI for a data set, so that it can be included as a so-called "first class" reference (like citing a Journal Article) in scholarly writing. Any modern scientific publication should adjust its practices to accept these DOIs as references, and it should encourage authors to seek these DOIs.
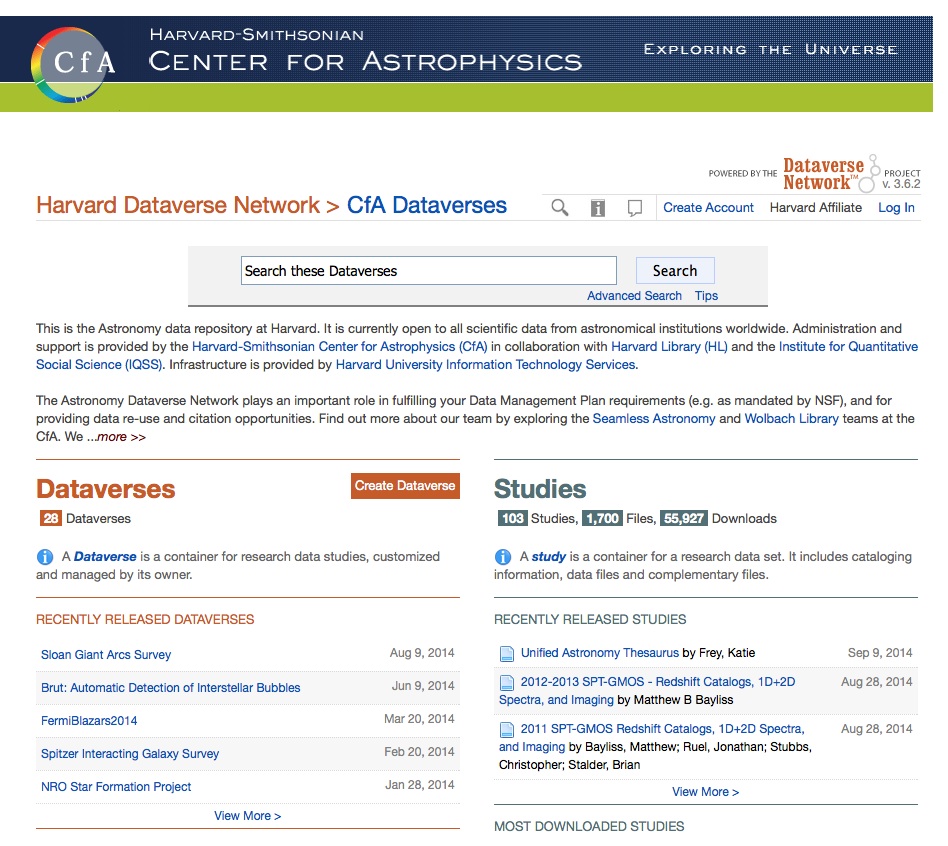
Homepage of the Astronomy Dataverse at Harvard,
which accepts, and automatically extracts metadata from, a wide variety
of file formats, including the Astronomical standard known as "FITS".
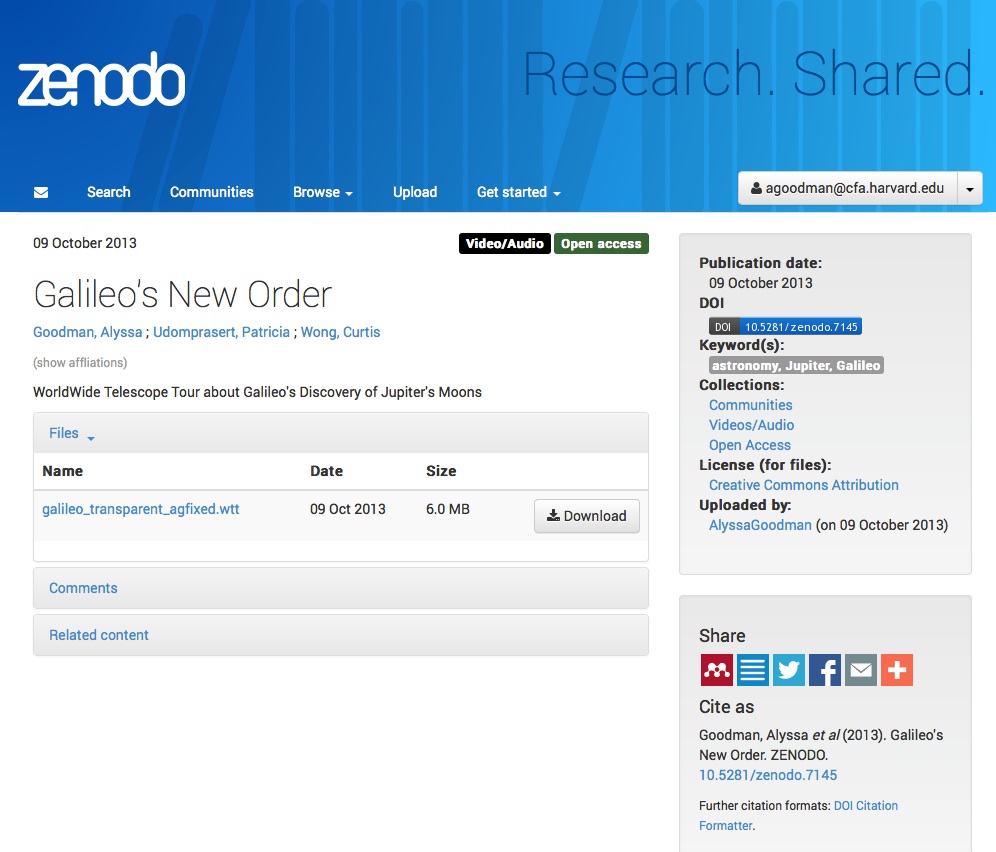
Screen shot of Zenodo page for "Galileo's New Order," a WorldWide Telescope Tour file, showing that essentially any file format can be assigned a DOI. The DOI link for this entry is http://dx.doi.org/10.5281/zenodo.7145 (Goodman 2013).
4 Offering Access to Code
In modern research articles, a paper is often linked to swaths of computer code that output both numerical conclusions in the paper (e. g. parameter estimates and errors) and associated figures. Since reproducibility is a bedrock principle of the scientific method, easy access to underpinning code is crucial part of future publications.4.1 Links to Software Programs
By combining tools discussed elsewhere in this document, once can "mint" digital object identifiers that point to a particular version of software, assuming it is stored in an organized repository. One example is given here: https://guides.github.com/activities/citable-code/, on a web page that shows how to mint a citable DOI for code using the GitHub and Zenodo services together. Alternatively, in a model more directly akin the way one currently publishes a paper, services like the Astrophysics Source Code Library (ASCL) allow authors to publish a static version of a program, and to assign that version an identifier. At present, The ASCL is indexed by the SAO/NASA Astrophysics Data System (ADS) and is citable by using the unique ascl ID assigned to each program.4.2 Executable Figures
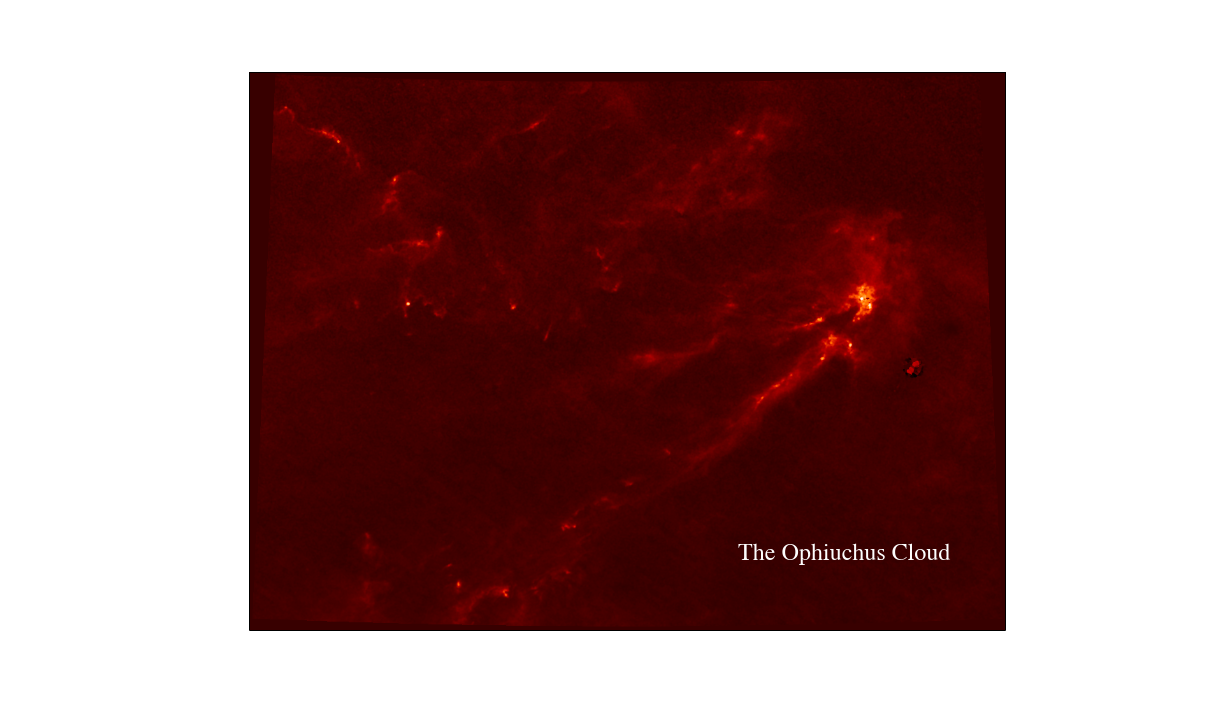
iPython Notebooks offer a nice modern example of how published figures can be made "executable." These notebooks act as code that can be annotated and executed on the web, allowing an interested reader to study and even modify a copy of the underpinning code, without contacting the authors or initiating a long investigation. the dust map of Ophiuchus inserted as a figure below (courtestsy of Hope Chen) offers an example of the iPython functionality. The colaboratory service is an interesting new alternative to running a hosted iPython solution. Hover over
the figure above and click "Launch ipython" to launch (and run) the code
that created this image in your brower. The Dataverse handle to the
data file used to make this plot is linked through hdl:10904/10081.
5 Better Storytelling
As we stated at the outset, communicating results by way of what cognitive scientists refer to as "storytelling" has the deepest, most long-lasting, impact on a reader, viewer, or listener. Until recently, journal articles only contained words, numbers, and pictures, but today we can enhance journal articles' storytelling potential with audio, video, and enhanced figures that offer interactivity and context. We consider each of these opportunities in turn, below.5.1 Audio
Audio can be used to narrate content in words, or to demonstrate a scientific concept. Today's scientist are most familiar with audio as the soundtrack to narrated videos that can standalone (as in recordings of talks), or that can accompany content within a paper. A narrated video example of the latter is discussed below, with reference to "Interacticity." Less familiar to most scientists today is the process of sonification (Diaz-Merced 2012), where information that may not be inherently auditory such as the power spectrum of the CMB or pulsations from Gamma Ray Burts are encoded into sound streams. For some, these sonifications can add another channel of data appreciation and formal publishing systems should be prepared to accept audio.5.2 Video
Video as an exploratory and explanatory visualization mode for scientific data has come of age. Many scientific talks today include some short video, explaining a concept that is better explained with moving images than with static figures. Some journals even publish nearly exclusively video, in fields where it is so instuctive on its own that less accompanying material is needed. For example, JoVE, the Journal of Visualized Experiments, began in 2006 as the world's first peer reviewed scientific video journal.Including video, like audio, is a challenge in standard journals, even when online, due to the plethora of video (and audio) file formats that potentially need supporting. It is a value-added service of a publisher to advertise which formats are acceptable, and to then migrate those formats in the future so that multimedia content continues to be accessible. Even the modern de-facto standard paper format, PDF, fully supports audio and video. Both can be included using only LaTeX packages and require no special technology. Videos can present sequential figures, true movies of time-variable phenomena, movies of simulated phenomena in time, or even commentary from authors.
Long-term considerations around video, other than the challenge of archiving and format migration, will also involve commenting. As discussed below, it is likely that authors will rely more in the future on the opinions of readers/viewers being recorded as they are included as "comments" attached to the media that form a publication. Commenting tools that involve video are currently maturing, but not robust. In the near future though, both video commenting and commenting on video are likely to be sought-after features.
5.3 Enhanced Figures
Historically, a figure in a paper is a static, in that it offers one unchanging view of the data authors wish to present. Often, though, adding an opporutnity to either manipulate a figure or see it in context lets a reader learn more. By using visualization software capable of outputting to formats that allow for interactivity, authors are not limited to a single view of a figure, and readers can explore beyond what an author-provided default view provides.5.3.1 Interactivity : Linking Views and Staging
A simple interactive figure gives its user an experience of playing with data, but in a very limited sandbox. Many top-tier news agencies (e. g. The York Times) have used and helped develop technology (e.g. the javascript library known as d3) that allows for the creation of interactive figures without a need for dedicated developers. Three key features of the emerging paradigm for ineractive communication of quantitative information are Brushing, Linking, and Staging. In the
example here, data about the discovery of moons of Jupiter is presented
in four "stages" of a story, each of which itself offers brushing and
linking between the two plots shown. The origin of this plot is
explained in this video narrated by Josh Peek. Technical steps to
creating this figure: 1) ingest data to Glue, a desktop linked-view visualization tool written in Python by Chris Beaumont; 2) output Glue results to d3po
(a prototype linked-view web tool written in d3 (javascript) by Adrian
Price-Whelan and Josh Peek); 3) ingest the d3po javascript output to Authorea,
producing the interactive figure shown above. For reference, Glue and
similar programs can also output to other javascript plotting tools,
such as Plot.ly, which are rapidly becoming more flexible and robust than prototypes like d3po.
5.3.2 Interactivity : Expressing 3D Information in 2D
The web as a publishing platform allows authors to include graphics that move. While stereoscopic 3D viewing on 2D surfaces is possible (and improving), cognition research shows that presently the best way for humans to understand 3D geometry on a 2D screen is to be able to manipulate 3D perspective views dynamically, so as to simulate views created by moving around in real space.As is the case with video or audio, many formats are available for presenting 3D graphics online, and a good publisher should advertise which of those will be supported and migrated in the future. Also as is the case with audio/video, the present de-facto standard, PDF, supports 3D objects in the Adobe PDF environment. Acrobat's 3D functionality allows for a selectable sequence of views of embedded 3D objects, in which each view can have a subset of objects visible from a given vantage point. The first interactive 3D PDF was published in a major journal (Nature) in 2009 (Goodman 2009), and a limited number others have appeared in major scientific publications since,e.g. Putman et al. (2012)
The tools for creating 3D PDFs were spun off from Adobe itself a few years ago, so presently, it can be cumbersome to generate such figures. A tutorial now exists that allows a user to generate a PDF with a 3D figure using LaTeX tools.
PDF has the advantage of offering a printable equivalent of an onscreen document, but it is not clear for how much longer a printable version take precedence over intereactive features. As long as a 2D screenshot (or its equivalent) can be included in an archival "printable" version of a paper, it seems adviseable for a modern pubisher to support a range of 3D interactive options, not just PDF.
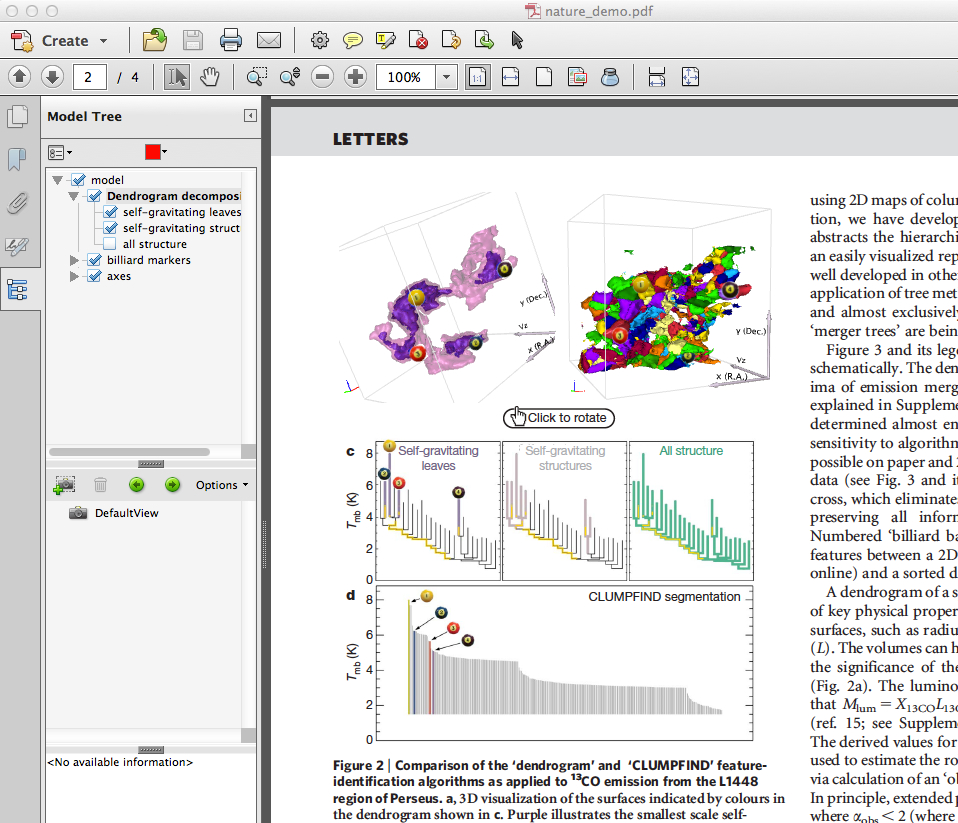
Screen shot of the first 3D PDF published in Nature in 2009 (Goodman 2009). A video demonstration of how users can interact with the figure is on YouTube, here. Open the PDF here in Adobe Acrobat to interact.
5.3.3 Putting Images in Context
Most observational astronomy has the unique feature of having a specific space to which the data are attached: the celestial sphere. As such, it makes sense for us to attach our images to locations. The AstroExplorer tool (cite) and the ADS All Sky Survey can allow images to be treated as data, in the sense that they can be "put back" on the Sky in context. Here's a sample, using an image from Barnard that is 100 years old (update). Click the caption's link to see it on the Sky in WorldWide Telescope.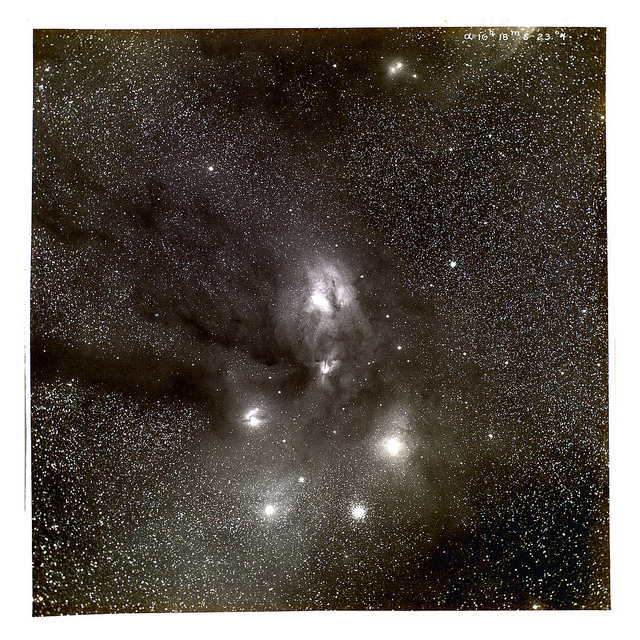
Click here to see this image on the Sky in your browser (using HTML5 WorldWide Telescope). Original image source.
6 Deeper, Easier Citations
Many scientists already use some kind of reference management system, whether it is a giant .bbl library alongside their local TeX installation, an ADS Private Libraray, or more sophisticated generalized solutions like EndNote, Papers, Mendeley, Zotero, etc.Inserting citations using any of these tools is relatively easy in nearly any of the online authoring systems discussed above (e.g. Authorea, shareLaTeX, writeLaTeX).
If an astronomer uses Authorea, inserting a reference is as simple as cutting & pasting the URL from ADS into the "cite" command. Cut and pasting DOI links also work in Authorea, as well as in other tools.
Generally, the whole business of citing material that has any kind of online identifier will continue to get easier and easier, and the challenge will be for publishers (and authors) to make the best use of the resulting accidental and purposeful specialized bibliographies.(Kurtz 2010)
7 Linking People
7.1 ORCID Identifiers
Open Researcher Contributor ID or ORCID is a free service that provides authors a unique persistent identifier and profile. ORCID identifiers are to people what DOIs are to online objects like papers, datasets, images, etc. Efficient use of ORCID identifiers by publishers will allow for improved search and bibliometric analysis of individuals' or instutions' output in the future.7.2 Social Media
Social media has already begun to take on the role of providing commentary on papers. While these formats are not directly linked to papers, it is worth noting that people are using platforms like Twitter to discuss papers, e.g. this disucssion on a recent astro-ph paper7.3 Annotation: Commenting and Markup
As the process of Science is not the production of scientific papers, but rather the conversation that takes place with and around these documents, the social context in which a paper appears is a crucial aspect we wish to capture. The rich repository of recorded audience comments on conference preceedings from bygone years is an example of how lightly moderated, unrefereed discussion centered on a document can vastly increase its richness. While these conversations are happening all the time over the internet (see Section 7.2), they are not tagged to specific parts of papers, nor are they easily collectable or moderatable.There is now a push, both in industry ventures and in open standards, to allow for the annotation of digital objects across the internet. The World Wide Web Consortium, responsible for developing web standards, has a working group on open standards, with a nice visualization of their ideas here. These standards are designed to support annotation engines within them, such as hypothes.is. There are also companies working on annotation specific to scholarly publications, such as Domeo and a vibrant community working on these problems. Technology already exists for referencing smaller parts of papers through component DOIs and, given the success of the DOI paradigm, this may be a ripe area for exploration of annotations for journals.
It is worth noting that the idea of annotation as a powerful communication tool is not limited obscure standards working groups and scholarly startups. Amusingly, the world leader in the fusty annotation movement is also the granddaddy of all "kids these days" exasperation: rap music. Rap Genius, and the expaned Genius brand started as an annotation engine for rap, but has expanded to a huge range of documents and ideas. Both rap music and scholarly work concentrate a huge amount of referential information into limited texts, which often need to be unpacked to be understood, even by expert audiences. Explicit, open discussion of these texts democratizes what has historically been insider information.
8 Future Media (Hard and Soft)
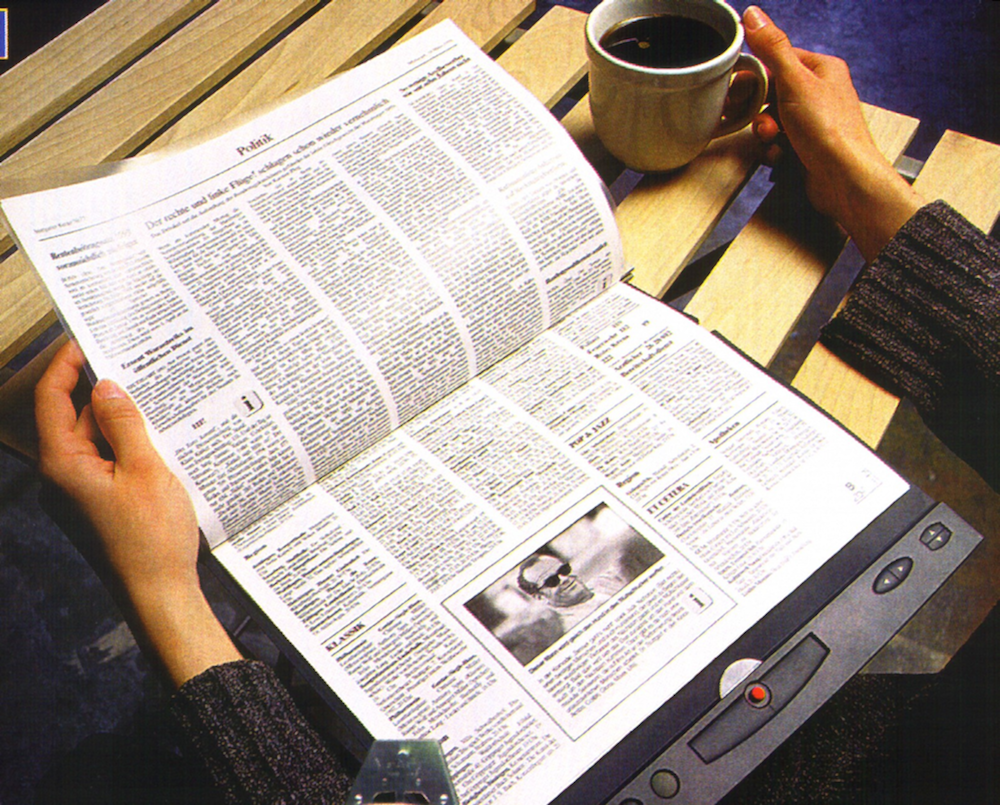
Random-access
media like bound paper journals or paper newspapers are currently
undervalued, and chances are they will make a comeback, using e-paper
where each "page" is repurposable. Any thoughts about a "Paper of the
Future" need to consider how media will serve us in the distant future.
Full compatibility is not required, but readability should be.
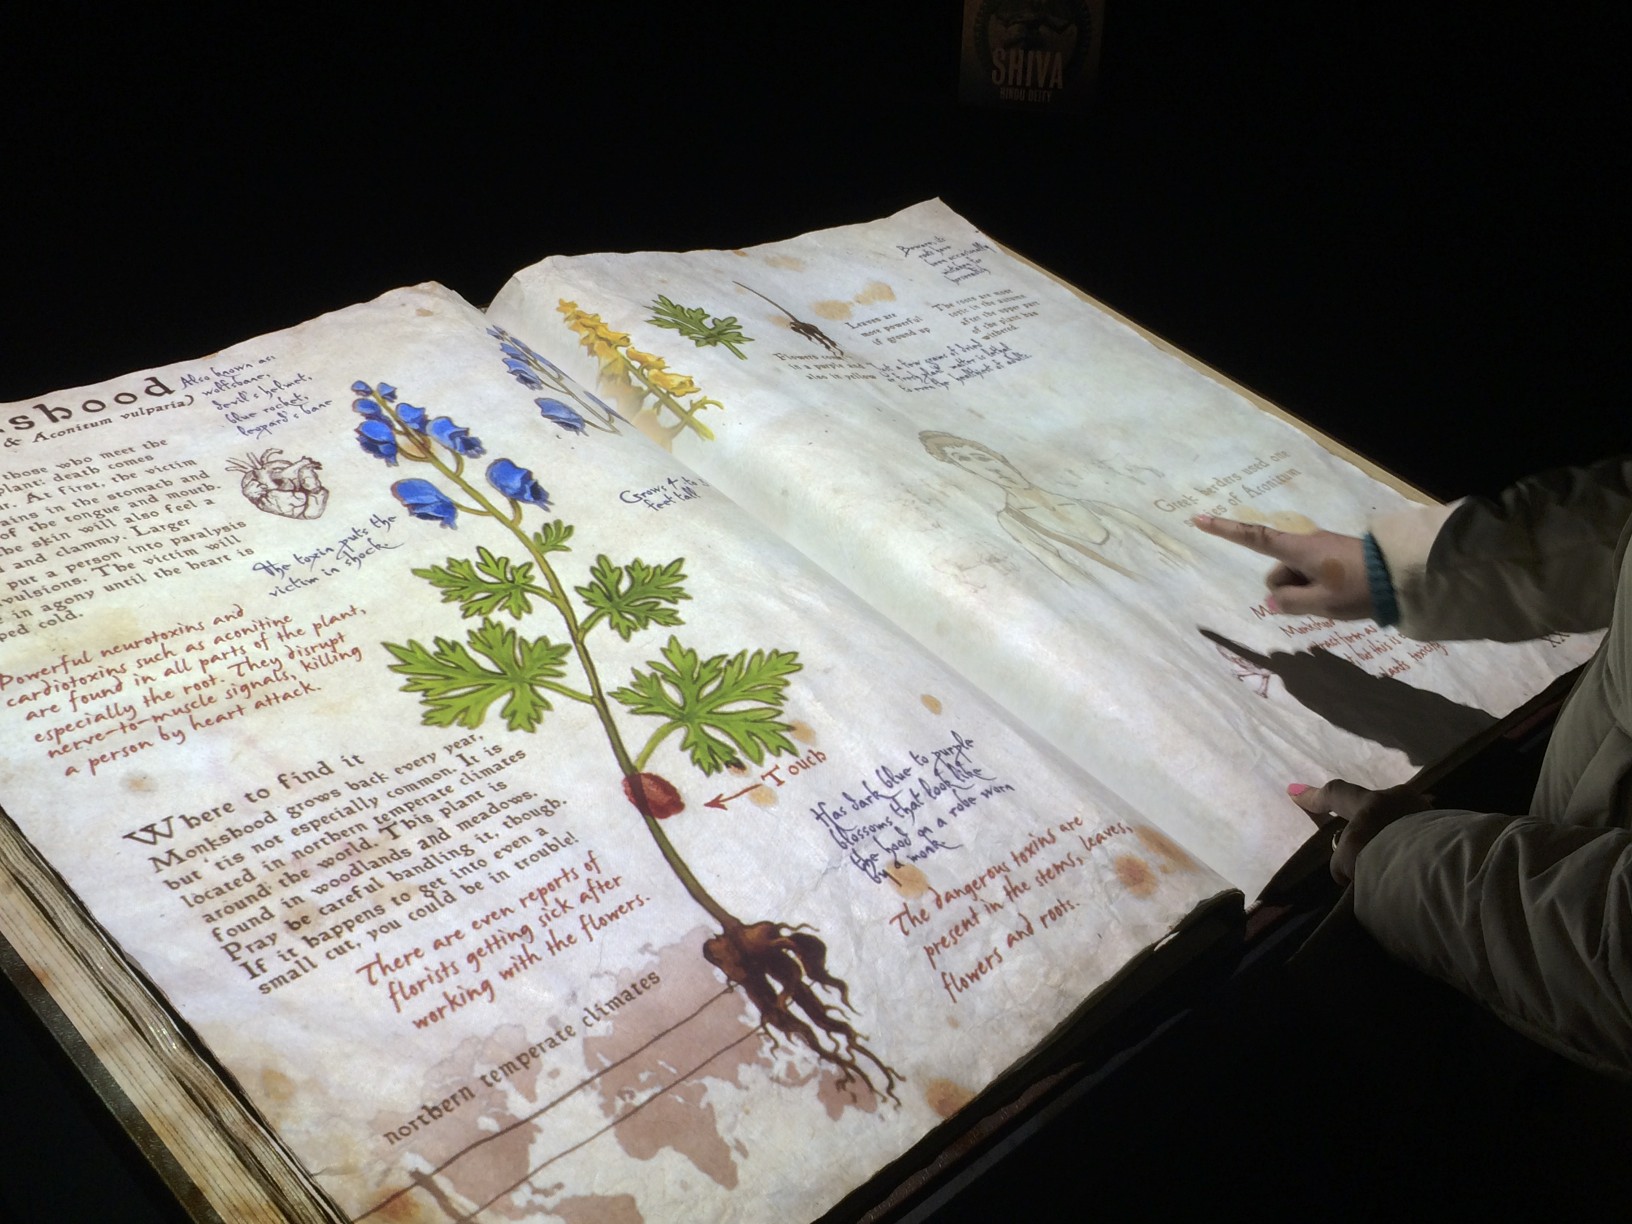
A "Enchanted"
book, with moving, changeable images, and interactive content, on each
physical page. On view at "The Power of Poison" display at the American
Museum of Natural History, in New York City from November 2013 --
August 2014. An online version of the material is at http://www.amnh.org/the-power-of-poison#page/,
but it is key to point out the the experience online, on a screen, is a
very poor substitute for the physical object--where each physical page
updates as it is turned.
9 Archival Value
Perhaps the main benefit of paper is in its value as an archival medium. Acid-free paper can last hundreds if not thousands of years, and the same can definitely not be said of digital media at present. For now, at least, there is clearly merit in thinking of how to assure that a printable summary of even a very interactive paper can be archived on paper. Services like the Internet Archive and Memento are improving year by year, but it is not yet clear when (if ever) electronic archiving will match physical archiving for long-term storage of information.References
The "Paper" of the Future - Authorea
