Dimensions
was built as a platform to allow stakeholders in the research
community, including academic bibliometricians, to more easily create
and understand the context of different types of research object through
the linkages between these objects. Links between objects are created
via persistent identifiers and machine learning techniques, while
additional context is introduced via data enhancements such as
per-object categorisations and person and institution disambiguation.
While these features make analytical use cases accessible for end users,
the COVID-19 crisis has highlighted a different set of needs to analyze
trends in scholarship as they occur: Real-time bibliometrics. The
combination of full-text search, daily data updates, a broad set of
scholarly objects including pre-prints and a wider set of data fields
for analysis, broadens opportunities for a different style of analysis. A
subset of these emerging capabilities is discussed and three basic
analyses are presented as illustrations of the potential for real-time
bibliometrics.
1 Introduction
The
COVID-19 crisis has changed the world on a grand scale. Its effects
have been seen in every country, at every level and in every facet of
life from social to professional. It is highly likely that the research
landscape has been and will be fundamentally altered both in the short
term and the long term as a result of COVID-19. The long-term issues are
likely to include: funding for research; expectations regarding the
public research sector's relationship with industry; expectations
regarding the role of universities in sustainable development; and the
role that institutions of higher education should be playing in
retooling and up-skilling the workforce (Frey, 2019; Carden and Young, 2020; Hook, 2020; Hook et al., 2020; Wastl et al., 2020).
While it is difficult to predict the future or even to guess the
persistent long-term effects of COVID-19 on the research environment,
COVID-19 does appear to have played the role of a catalyst and
accelerant for change in the short term. We argue that the signal for
some of these changes can already be observed in the data that is to be
found in scholarly search databases and other modern technology-driven
tools that support the research ecosystem.
In this
paper, we propose the concept of “real-time” bibliometrics as a new
capability for researchers, policymakers and analysts across the sector.
The cornerstones of this emergent capability are: data processing that makes use of automated techniques (allowing timely data updates); and, data delivery
via an API or other direct-access technologies (e.g., Google BigQuery)
that give the user more scope to work with data directly without either
the need to duplicate large portions of the database to derive insights,
or the need for an expensive infrastructure. Tools that exhibit these
types of approach include Microsoft's Academic Search, Allen Institute's
Semantic Scholar, and Digital Science's Dimensions. Given the current authors' domain expertize, backgrounds and affiliation we have chosen to focus on Digital Science's Dimensions
as the core for our analysis here. In addition, we have chosen
specifically not to perform a product comparison as we feel that this
would be better performed by others. Rather we illustrate the concept of
real-time bibliometrics through three simple examples laid out below.
The idea of real-time bibliometrics suggested itself after we realized that there are four key features of the Dimensions
platform that result from the original design aims, and which allow
analysis of rapidly emerging events that impacts the research world,
such as COVID-19. These are:
1.
The inclusion of preprints and other content types such as awarded
grants, patents, clinical trials, datasets, policy documents and
scholarly (citation-based) and public (Altmetric) attention sources
gives access to a broader range of potential signals for analysis1;
2. Inclusion of full-text search indices on all object types. Note that while all object types in Dimensions
do have the capacity to have full-text associated with them for
indexing, only 77 m of the 110 m scholarly articles are available for
inclusion in the search index at the time of writing and that, for
non-publications object, different bodies of text constitute full text
(e.g., while for a patent this is the full text of the patent
application, for a research grant this is typically limited to either a
lay summary or a short abstract);
3.
Daily data updates. It is a common theme that recently developed
technology resources that support scholarship make use of
machine-learning technologies. One way in which these technologies are
deployed is to allow data enhancements such as subject categorization,
person disambiguation and institution disambiguation to be applied in an
automated way. This technology approach focuses curation resource on
improving algorithms rather than improving individual data items. This
shift in focus means that data can be added much more quickly to the
Dimensions index and hence analysis can be performed daily;
4.
The provision of programmatic/high-volume routes to access data. Many
products now provide APIs that allow those familiar programming
techniques to extract and analyze more data than is available in the web
version of the product. Such APIs are demonstrated in the methodology
behind the analyses included in the current paper. However, for even
better real-time, high-volume access to data with the capacity to
perform complex calculations in the cloud, mixing tools such as Dimensions with cloud compute platforms such as Google BigQuery, Snowflake or Amazon Redshift open up even greater potential. The Dimensions
team have chosen to use the Google BigQuery platform to share their
data. A free dataset that includes all COVID-19-related research objects
from Dimensions can be found at (https://console.cloud.google.com/marketplace/product/digitalscience-public/covid-19-dataset-dimensions).
The
combination of these facets allows analysts and researchers to carry
out real-time bibliometric analysis. Historically, most bibliometric
analyses do not require real-time data, however, we believe that the
COVID-19 crisis has demonstrated one use case where this capability
should be of broad interest and that this will lead to the development
of further use cases where this style of analysis is relevant.
This paper does not attempt to be an exhaustive summary of all of the different use cases that may be explored in Dimensions.
Here, we limit our attention to three examples related by their use of
publication and citation data. Further examples that make use of
clinical trials, grant and patent data may be found in Hook et al. (2020).
Rather, the focus of this paper is on three basic analyses that do not
make use of state-of-the-art bibliometric and scientometric techniques
(such as those used in Suominen and Toivanen (2016); Zhang et al. (2016)),
but instead focuses on simple approaches that demonstrate the potential
of real-time bibliometrics in an easily accessible manner to a wider
audience.
This paper is organized as follows: In the Methods section, we describe some of the key facets of the Dimensions
database and the techniques that have been used to query the data. In
the Results section, we have included the three analyses described
above. Finally, we make some observations in the Discussion section. For
brevity hereafter, we habitually contract COVID-19 to COVID.
2 Methods
2.1 Database
The Dimensions
database comprises of a set of stores of data that hold information on
different types of research inputs, research outputs (which we
collectively refer to as “research objects”) together with the different
types of attention accrued by those objects. The database constitutes a
step towards a complete picture of the overall research landscape and
helps to bring context to not only an individual piece of research, but
also to a researcher, a research field, an institution, a funder, a
country, and many of the other major research-related entities that may
be of interest to stakeholders in the research world. Dimensions
does this by merging openly available data with data from proprietary
sources and enhancing both using persistent identifiers and
technological approaches. Editorial guidelines for material to be
included in the database are simple and transparent—there must be a
reliable source for the data and each entity in the system must be
associated with a recognized unique identifier. A more comprehensive
description of how the database is constructed is included in Hook et al. (2018).
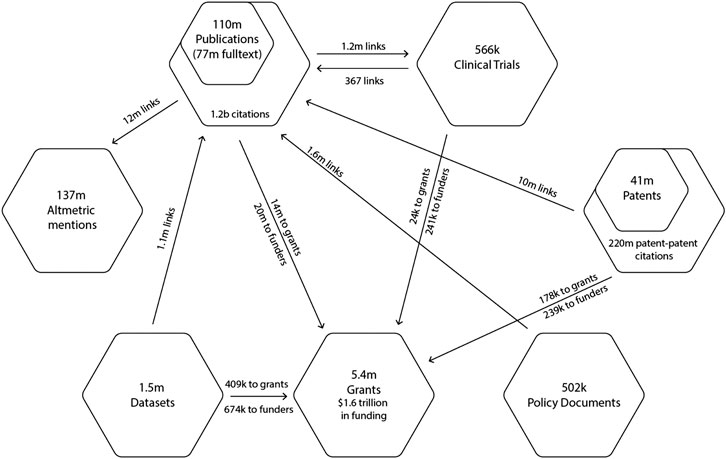
At the time that the analyses described in the following sections was performed, the Dimensions
database contained more than 110 m publications (77 m with full text),
1.5 m datasets, 5.4 m grants, 41 m patents, 566 k clinical trials, 502 k
policy documents and 137 m Altmetric mentions. Figure 1 summarizes Dimensions’ data holdings and the number of links between entity types at the time of writing.
To
study the development of research related to COVID, we needed to
construct a robust search string to identify material. Data Scientists
in the Digital Science team collaborated with subject experts to
formulate the Boolean query in the box below, which was used to search
titles, abstracts and article full text, where it was available in conjunction with a date restriction to 2020.
“2019-nCoV”
OR “COVID-19” OR “SARS-CoV-2” OR “HCoV-2019” OR “hcov” OR “NCOVID-19”
OR “severe acute respiratory syndrome coronavirus 2” OR “severe acute
respiratory syndrome corona virus 2” OR ((“coronavirus” OR “corona
virus”) AND (Wuhan OR China OR novel))
This search
string (together with the date restriction) was designed to be
inclusive: by which we mean that it included all relevant outputs at the
risk of introducing false positives. The definition of a false positive
in this context is open to interpretation. For many, a false positive
will be the addition of an article to the COVID dataset that is not
centrally linked to COVID, but which only mentions COVID in passing
without it being a central theme of the research output. Such articles are
included in the results of this query. We deem this approach to be
reasonable in the current setting since, in a broader sense, the
inclusion of these non-central articles does provide a signal that
represents of the level interest in the academic community relating
COVID and helps to quantifying the overall level of research activity
related to COVID. The articles included in this search results are also
not limited to medical papers reporting infectious disease research,
virology and vaccine-related technologies. The field of COVID-related
research is significantly broader and includes not only research related
to the disease and the effects of lockdown such as: epidemiology;
public health; mental health and economics, but also, for example,
socialogical issues such as the effect of the pandemic on minorities,
the environment and tourism. The dataset that we find from Dimensions
is also not limited to fully academic articles, but also includes
academic news articles such as those found in Nature journal that have
been given DOIs. Again, in attempting to quantify, classify and
contextualize the output of the academy related to COVID, we do not see
these articles as irrelevant to the present analysis.
For ease of access, the most current version of this query is linked to via the shortcut http://covid-19.dimensions.ai, which was recommended by the Chinese Academy of Science to help its researchers locate COVID-specific research (Kundu, 2020).
The query was used to define further resources that have been made
broadly available (for free and without the need for any subscription or
data license): firstly, the resulting dataset is available on figshare
(updated regularly) at https://doi.org/10.6084/m9.figshare.11961063.v21. There is also a live connection to the current data on Dimensions through Google BigQuery https://console.cloud.google.com/marketplace/product/digitalscience-public/covid-19-dataset-dimensions.
2.2 Data Extraction and Processing
All
data featured the figures contain in the results section of this
article can be found on Figshare (details in the data statement).
Different types of data in Dimensions are updated with
different frequencies. For example, per-article open access data is
updated frequently in the source at Unpaywall, but Dimensions updates these data on a less frequent basis (every few days). Hence, while Open Access data in Dimensions
is appropriately sourced to meet most use cases, it is not yet
fully-aligned with the “real-time” biblioemtrics discussed here. As a
result, when we perform the real-time analysis for this article, we
actively query the Unpaywall database to ensure that the most recent
data is included in the analysis.
Figures 4, 7, 8, 10, 11 are all produced using the Dimensions API. Figures 10, 11 use the Force Atlas 2 graph layout algorithm in the Gephi graph visualization software package (Jacomy et al., 2014).
Figures 2 and 3 are based on data that has been extracted from Dimensions’ full-text archive rather than the standard data that is made available in either the Dimensions
web interface or API at the current time (although the data for this
study are included in the data release vested on Figshare and associated
with this paper). Around 20% of records in the Dimensions core
have data for: date of submission, date of acceptance, and date
available online and date of publication associated with them in a
consistent manner that allows the analysis that we have carried out.
A further important aspect of the analysis behind Figures 2, 3
is that we can not rely on the COVID query defined above as the basis
for a three-year comparison of behaviors. Since the query is defined and
optimized to track the objects that relate to COVID-19, it does not
pick up any results prior to 2020, and hence cannot be used to create a
baseline for three comparable years. While we could perform a general
research on “coronavirus” the number of research results from this field
in previous years would lead to a dataset that would be too small for a
robust statistical analysis. Instead, we argue that a robust proxy that
includes much of the medicine-centric COVID-19 research today can be
built by including articles in the following RCDC categories:
“Infectious Diseases”, “Emerging Infectious Diseases”, “Clinical
Research”, “Lung”, “Vaccine Related”, “Biodefense”, “Pneumonia &
Influenza”, and “Pneumonia”. While this removes the non-medicine-related
articles from the query that we have engaged with previously, it is
these fields that are mostly likely to have had increased pressure to
publish work and in which there is most likely to be a statistically
significant effect. For each year in the study, papers accepted between
2nd January and 31st July are included. This choice of date is
indicative of a specific class of data issue that we need to allow for
in these analyses, namely the use of “default” dates in computer systems
and metadata in scholarly publishing. In this case, that 1st January is
used by many publishing systems as a “default” date used to represent
not only 1st January but also, January as a month and the whole year. It
is screened out in this analysis. We have included the first day in
other months as, while these dates are also often used as a proxy for
the whole month, this is a less statistically significant effect and
leads to a proportionally lower error (up to 1 month) compared with up
to 1 year in the January case.
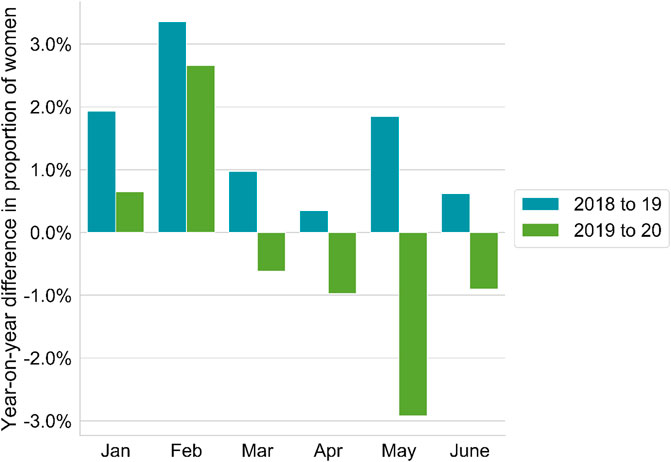
Figure 12
makes use of a “gender guessing” algorithm that is applied to the
author names associated with the articles and which classifies each
author up to a certain tolerance using the first name of the author. We
need to take a statistical approach given that this algorithm cannot
achieve 100% accuracy, even if the data were perfect. Since we wish to
use statistical approaches, the number of papers must be sufficiently
large as for that style of analysis to be applicable. As a result, we
considered publications across all subjects, regardless of their link
with COVID research to form our baseline for this behavioral analysis.
We used Dimensions’ data for the first six months of each of
the last three years: 2018, 2019, and 2020. We calculated the proportion
of women who had submitted articles every month, excluding authors
whose genders were impossible to guess from their first name (i.e. names
used for both genders or without enough information). We then
calculated the difference in percentages for cooresponding months in
each year.
3 Results
3.1 Timescales in COVID
The
question of whether the system of scholarly communication is fit for
purpose in the context of modern research is again being tested. The
prodigious rise in COVID research has already caught the attention of
many in the scientometric and scholarly communications communities (for
example Brainard (2020); Colavizza et al. (2020); Torres-Salinas et al. (2020))
as well as the broader academic community. The emergence of COVID
research as a new field, is taking place at a substantially accelerated
rate compared to the usual development that one might expect in a usual
situation. There are several caveats that must be drawn from the current
situation. Firstly, that bibliometrics as a field is not well
positioned with tools to support the analysis such a rapid expansion.
Typically, bibliometricians and scientometricians are used to working on
substantially longer timescales. Secondly, the definition of an
emergent research area is seldom so cleanly and simply articulated as in
the boxed search string above. The normal pace of development of a
research field is usually inextricably linked to the speed of the
emergence of technologies, theories, and discussion and socialization of
ideas. However, in the case of COVID there is an powerful exogenous
driver.
While it is tempting to think of COVID as a
microcosm in which we can study the emergence of a field, with the
parallel development of the social structures, in an accelerated manner,
this is not the case. The development of the field is a development
under stress and with a specific goal in mind for a large proportion of
the field (a vaccine) and on a specific timescale (as soon as possible).
We can define the core areas of COVID in general terms to be the search
for a vaccine, the spread of the disease and the public health
implications of the virus. A non-exhaustive set of adjacent areas might
include: the study of the economic impact of COVID on global markets,
the impact on specific sectors such as the travel industry, the economic
recovery from COVID, the mental health aspects of an extended period in
lockdown, the effects of the crisis on people based on race, social
status, gender and age. In each case, advances in research in adjacent
fields are often perceived to be under less time pressure than those in
core areas related to health.
As a result, any
analysis of the sociological behavior change of academia itself as a
result of COVID, is likely to have limited applicability. It should be
thought of as a case study of a system under stress and consequently
lessons that are drawn from such an analysis are relevant to comparable
systems and should not be considered to be generally applied.
Nonetheless,
we are observing elements of culture change during this period that may
survive the immediate crisis. The current stressful situation is also
highlighting several deficiencies in the structure of scholarly
communications and a variety of social issues in academia at large (Minello, 2020; Viglione, 2020).
In this section, we will specifically, study the need to publish at
speed in the current situation, the format of publication, verification
of results, and access to those results.
The first
analysis presented in this paper concerns the change in publication
practices in the community as a result of COVID. During a period of
epidemic (or indeed pandemic), the work of the research community
becomes more time-critical. The speed with which results are shared
between researchers is a key factor in developing approaches to saving
lives. International barriers, considerations of professional academic
advancement and frameworks of evaluation take second place to solutions
that improve the chances of survival of those infected. In the case of
COVID, a vast number of researchers from around the globe have turned
their interests to COVID research (Hook et al., 2020),
with the effect that the volume of publication in this newly emergent
area has reached more than 105,000 publications in 6 months - this
constitutes around 3% of the world's research output so far this year.
As a matter of comparison, other fast moving areas such as “Deep
Learning”, have taken more than 6 years to reach a comparable number of
outputs in total. In 2019, Deep Learning achieved a total of 99,000
publications in a single year, following a decade of development. A
number that COVID eclipsed after just 6 months in 2020.
The
need to share advances more quickly has led to two related
developments: i) the use of open access to ensure that all developments
are shared globally, and ii) the use of faster publication routes. Both
of these needs are met by the preprint publication format as preprints
are both open access and, since they pass through no peer review
process, they are instantly available to the community. The lack of peer
review in preprints has given rise to a wide range of concerns (Kwon, 2020).
Academic publishers have been quick to engage with these challenges
firstly by making COVID-related publications available in through open
access channels and secondly by decreasing peer review times.
Preprint
publications have minimal submisssion-to-publication times and have
become well established in some fields as a way not only to rapidly
communicate research results but also to establish priority. There are,
however, well documented challenges with low-touch or no-touch review (Chiarelli et al., 2019).
Many peer review servers have a short delay between submission and
publication in order to do basic checks on manuscripts. However, this
delay is typically on the order of a few days. By comparison with the
traditional process, the average time from submission to acceptance and
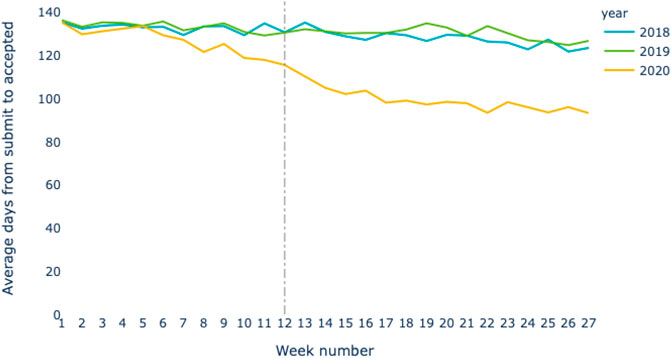
on to online publication of a manuscript, averages around 170 days. Figure 2
shows the average time from submission to acceptance based on the
availability of data submission and acceptance dates in the full text
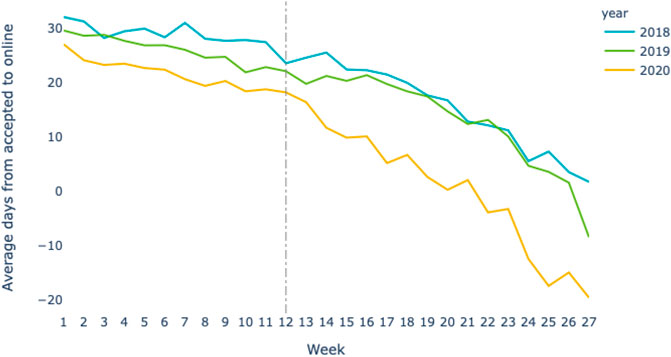
records of the Dimensions databsae for the subset of fields involved in COVID research as discussed in Section 2.2; Figure 3
shows the average time from acceptance to online availability on the
same basis as the previous plot. In each plot data is shown for the
three years 2018, 2019 and 2020. The 2018 and 2019 lines establish the
average time of the state-of-the-art in either peer review or post-peer
review manuscript processing. In Figure 7
the time from submission to acceptance is fairly constant at 130 days
whereas, in 2020 (yellow line), this time has reduced by around 40 days
to less than 100 days. In Figure 3
we see that the average number of days from manuscript acceptance to
online availability is generally trending down. This, we speculate, is a
result of improvements in publishing processes and increased
willingness of publishers to post manuscripts that are accepted subject
to minor changes or which are already part of a preprint to review
pipeline. However, the 2020 line (yellow) in this figure shows that this
part of the process also has significantly decreased during the COVID
period.
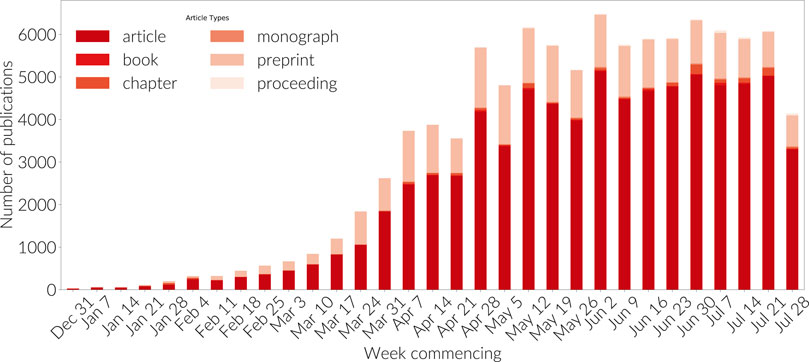
Peer review forms a critical piece of the
scholarly communication process, ensuring the validity of research
before it is broadly shared. However, it is a slow process as the
comments of peer reviewers are addressed and responses iterated between
authors and reviewers. The typical periods of peer review were clearly
long enough during the early era of the COVID crisis to induce
researchers to try out preprints as a mechanism to share their research,
as seen in Figure 4. Hook and Porter (2020)
noted that preprints have rapidly become established as a mainstream
research output. Several other analyses have also appeared to examine
this phenomenon Fraser et al. (2020).
We speculate that preprints have not gained more traction in medicine
in spite of COVID as a motivating influence due to a combination of
effects:
1. substantial progress toward finding a vaccine may have alleviated pressure to share results rapidly;
2. Increase in speed and efficiency in the speed of peer review, as demonstrated in Figures 2, 3 and discussed by (Eisen et al., 2020; OASPA, 2020);
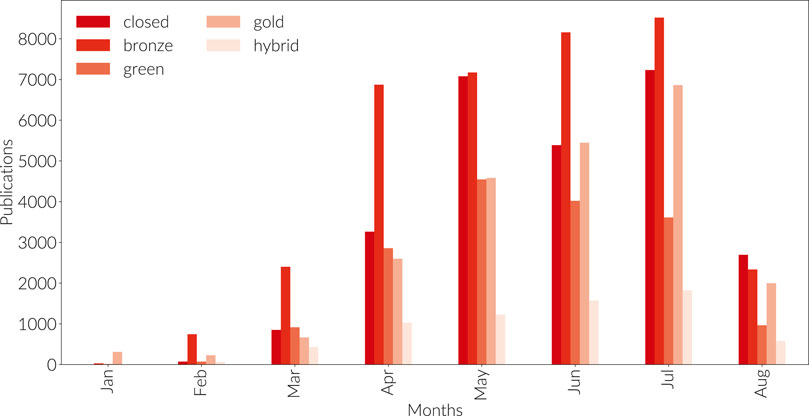
3. publisher commitments to make COVID-related papers available through Bronze Open Access (as illustrated in Figure 5),
as well as early publication of manuscripts that have completed the
peer review process but while they are still in production Carr (2020a, b); Kiley (2020);
4. concerns over circumvention of the peer review process as a quality check (Chiarelli et al., 2019; Johansson and Saderi, 2020; Kwon, 2020).
In
summary, even in spite of the need for speed of communication, there is
a competing need to ensure that information can be trusted and hence
researchers continue to need access to infrastructures that allow for
the trustful dissemination of research both within and without the
community.
3.2 Evolution in Collaboration
It
is seldom that it is possible to examine the emergence of a field in
real time. In the case of COVID research, we have an unparalleled
opportunity to do exactly that. However, care needs to be a taken, this
is not the typical growth of a field. To borrow a concept from physics:
when crystals grow in a natural environment they have a certain
structure and uniformity; however, when they are fabricated in
conditions that accelerate their growth, there are often different
features and defects that emerge, and so it appears to be with the field
currently establishing around COVID research. The field is drawing from
many other specialisms and is accessing different networks in different
geographies. Initially, development of research followed the incidence
of the outbreak of the disease - starting in China, moving to Europe and
eventually to the United States. This spread is reflected both in
publication and clinical trial activity (Hook et al., 2020).
Through the data in Dimensions
coupled with full-text searching capabilities it is possible to see
this evolution day-by-day, week-by-week. In this section of the paper,
we relate a high-level analysis of the development of the field of COVID
research and the development of the international picture of
collaboration during this period of development.
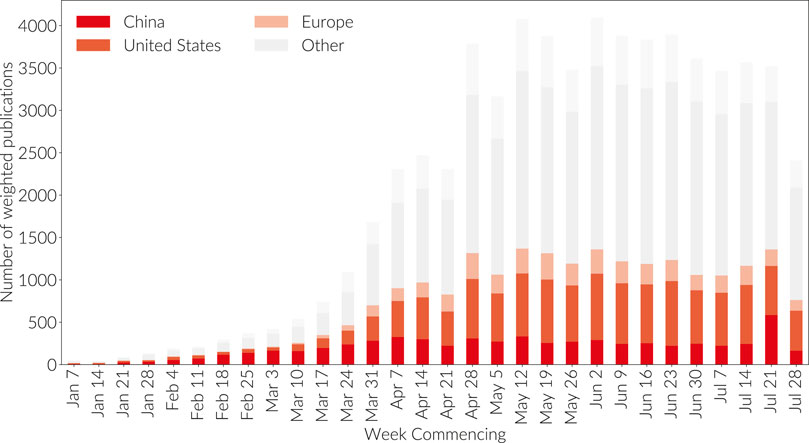
First
of all, we look at the rise of COVID publication by country so that we
understand how the geographic locus of COVID research has developed with
time. Figure 6
shows the level of publication production, highlighting the top
producing countries. It is generated using the GRID database of
institutional affiliations (see http://grid.ac).
For each publication where there are institutions associated with the
authors, the paper can be partitioned into the contributions from each
country. A normalization is applied such that each paper continues to
contribute a count of one in total across all contributing countries.
Hence, if a paper is co-authored with two authors associated with
institutions in the US and three authors associated with institutions in
China, then 3/5 of the paper will be attributed to China and 2/5 of the
paper to US. The graph is not cumulative but rather it represents the
number of papers appearing in the week commencing at the date marked on
the axis. The top 12 producing countries (over the full time period) are
listed explicitly, countries outside the top 12 producers in aggregate
over the period are agglomerated into “other”, authors (proportions of
the paper) associated with institutions that contributed but which are
unknown to GRID or which cannot trivially be mapped to GRID are listed
as “No Afiliation”.
From Figure 6
we see, unsurprisingly given the earlier need for a vaccine and
(unfortunately) the availability of infected subjects, that China took a
leading position in the early development of COVID research. Since
early April, however, China has plateaued in research volume and the
main growth has been in the US and European research base. However,
China's first-mover advantage established its publications as
foundational to this new field in both in highly respected journals and
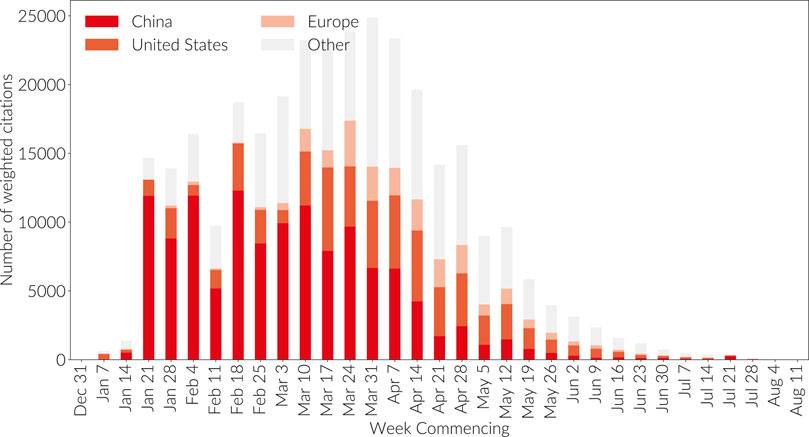
in shear volume of citations. Figure 7
Shows the COVID-related citations made in each week by country of
target publication. Hence, if a new publication was published in the
first week of May citing a paper from February on which 50% of the
authors were affiliated with Chinese institutions and 50% with United
States institutions, then a value of 0.5 will count toward the orange
color representing the United States bar in the May 4 bar, and 0.5 will
count toward the deep red bar representing China. It is clear that
Chinese research has receive a great deal of attention.
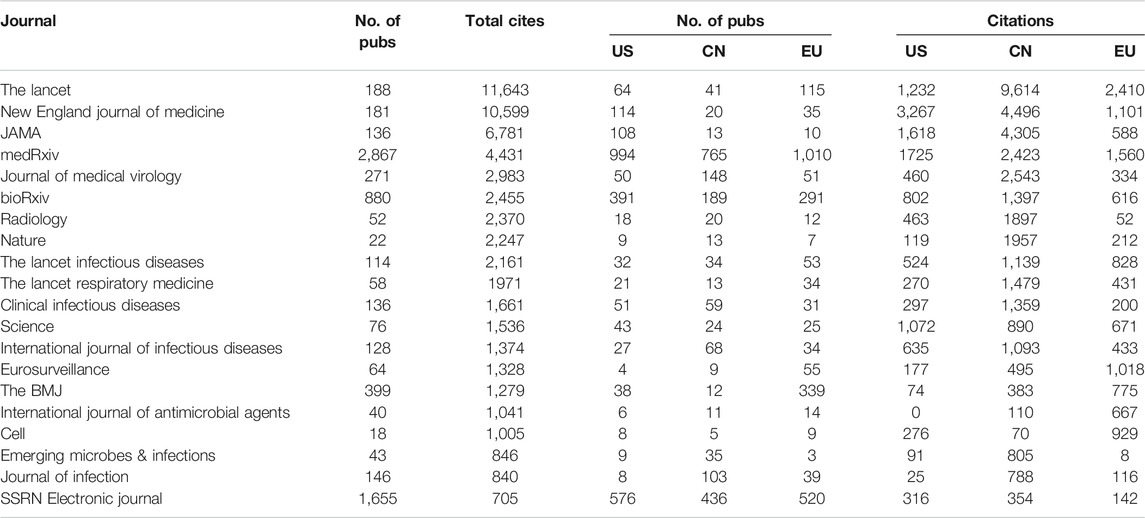
Table 1
lists journals ordered by the number of COVID-related citations they
have received. A COVID-related citation is defined to be a citation to
an article that is returned from Dimensions in response to the
boxed query. The “No. of Pubs” column lists the number of COVID research
outputs published by the venue until May 24, 2020—note the high volumes
for the preprint sites medRxiv, bioRxiv, and SSRN. The paper totals in
the table are not rounded fractional counts but whole papers that
involve either a US-based, China-based or EU-based author
respectively–hence, there will be double counting between the US, CN and
EU columns in the case of collaborative research. Our own analysis
(below) shows significant collaboration within established international
networks, albeit at a low rate relative to “normal running”. This
analysis is supported by the results of Fry et al. (2020). The EU is defined to include the EU-27 countries, the United Kingdom, Norway and Switzerland.
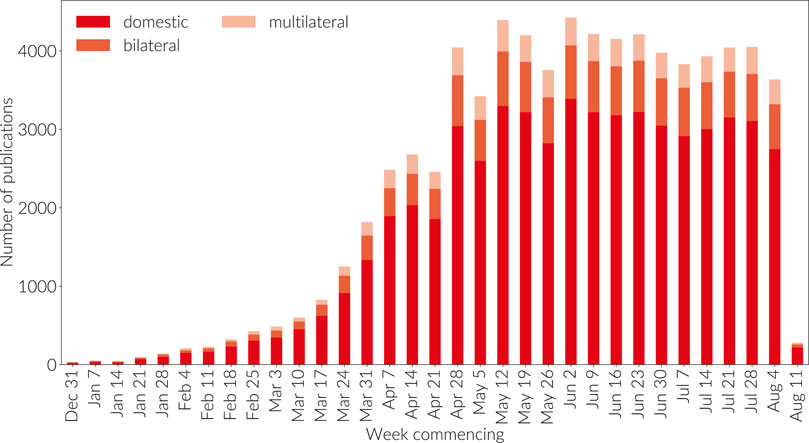
The
international multidisciplinary science journal Nature asserted that
politicians can learn from researchers’ collaboration habits (Skipper, 2020), but while we see strong collaborations on the scaffolding of established academic networks (Fry et al., 2020),
it is clear from our analysis that the overall proportion of bilateral
(specifically two countries) and multilateral (more than two countries)
research collaborations is still embryonic. Indeed, Figure 8
shows that while the proportion of internationally co-authored work is
steady, the vast majority of research on COVID to date has been authored
within countries. It is well established that international
collaboration is rising across subjects (Adams, 2013) so we interpret this graph to show the early stage of the field.
There
are several factors beyond the nascent stage of COVID research that may
have contributed to early trends in international collaboration.
Firstly, China is a strong contributor to the data in the early months
of Figure 8.
China's research capacity has been growing so rapidly that the rest of
the world lacks the capacity to keep up with China's expanding research
base and hence, despite becoming the favored collaboration partner with a
growing number of countries around the world, the international
footprint–the ratio of domestic to international papers in China–is
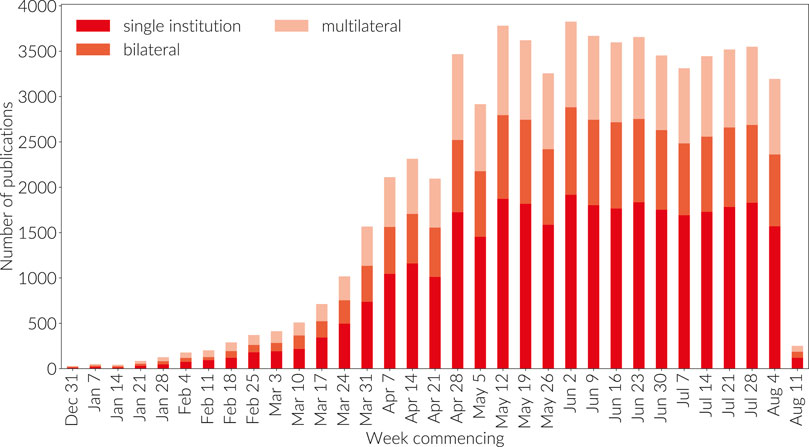
currently against the world trend. The international picture is mirrored
at institutional level as can be observed in Figure 9.
During January, February and March a significant proportion of research
took place not just within a single-country setting but also within a
single institution setting. While this remained the dominant behavior in
April and May at the country level, we can see the emergence of greater
inter-institutional collaboration in these months as the collaborative
network starts to establish and a stabilization of inter-institutional
and international collaboration at more normal levels in June, July and
August.
A large proportion of the research in Figure 8 is medical. Hence, we may speculate that a further potential effect at play in Figure 8
is that many researchers may feel pressure to make headway with a
vaccine. As a result they are, in the early period of their research,
focusing on developing their understanding of COVID rather than
developing international collaborations. This tendency may be compounded
by the nature of funding that is emerging in many countries, which is
small scale, and targeted at small groups or individuals. This may make
sense since the complexity of developing a COVID vaccine was, in the
early period of the research, not well understood. It appears simply to
take time to establish relationships on a new research topic, even when
connections are already in existence.
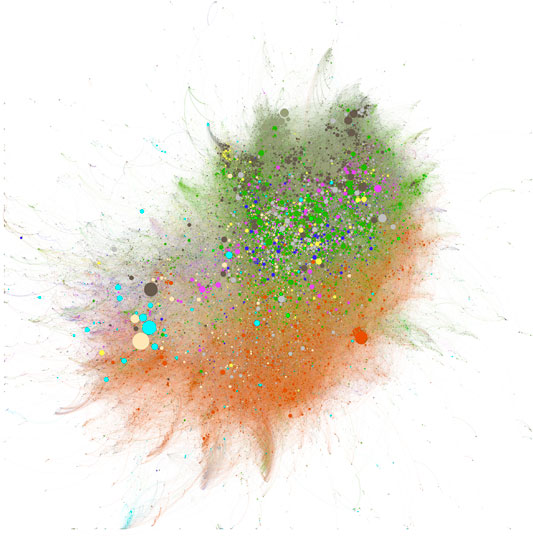
Each of the two
figures has the same basic structure, but different coloring has been
applied to emphasize different aspects. Each of these figures depicts
50,979 researchers, each of whom has published a COVID paper. These
researchers are derived from the Dimensions person graph and
hence are not dependent on address information from COVID papers to
derive these visualisations. The 488,188 researcher-researcher links
represented in the diagram are not identical (i.e., links between
co-authors are not duplicated with multiple co-authored papers), and
relate to any relationship that has been established through the whole
research career of the researchers involved, not only the COVID period
of research. Thus, these figures show the full “COVID-activated” network
of researchers.
In Figure 10
the confused distribution of colors makes it clear that COVID is
already highly interdisciplinary with respect to the NIH's RCDC
categorization scheme, which classifies different disease areas.
Broadly, three areas emerge: first, the area characterized by the mix of
cardiovascular (olive), clinical (green), lung (dark blue),
neurosciences (yellow) and digestive diseases (purple); second, an area
to the south of this highly mixed patch that is dominated by infectious
diseases (orange); lastly, the peripheral group on left of the figure
with a prevalence of light clustering of bioengineering (light blue) and
genetics (light brown). This complex landscape indicates how
multifaceted this research area has already become. Under this
categorization, neither preventive medicine nor epidemiology/public
health, both mainstays of the overall body of research in this area,
emerge as coherent collaborative blocks.
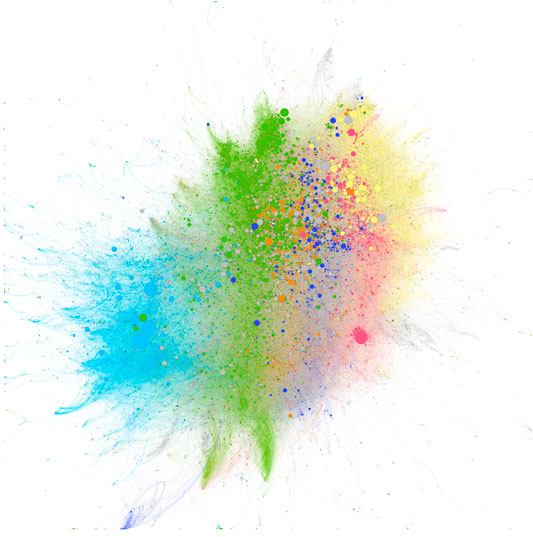
Figure 11 shows the same background as Figure 10
but is colored by the current country of the institutional affiliation
of each researcher. It is clear from this version of the graph that the
clustering, and hence the overall structure of the network, is much more
influenced by geographic collaborations than by subject collaborations.
This is entirely in line with our findings from Figure 8, where we saw a high percentage of domestic collaboration and Figure 9
where we even saw that institution-specific localization was still
significant at this time. We see distinct ‘banded’ collaborative
structures for each of the main COVID-researching countries: China
(light blue) on the left, collaborating most strongly with the US
(green), which is highly integrated with the United Kingdom (orange) and
Germany (dark blue), which are, in turn, integrated with France (pink)
and Italy (yellow). The European countries show a high degree of
integration, with the United Kingdom being highly collaborative and
hence more diffuse in the picture.
Both Figure 10 and Figure 11
are subtle to interpret. However, one way to think of this network is
as follows. All the researchers represented in the plot have published a
COVID paper. Since we have clustered them based on their prior
collaboration history as well as the COVID collaborations, we can think
of each link as having a particular state of color: If a collaboration
between two researchers does not contain a co-authored COVID
publication, then we could color the link grey, and if it does contain a
COVID publication, then we could color the link red. To assess how much
of the collaboration graph has been accessed/created as a result of
COVID, we can look at the proportion of the graph with grey links vs.
red links. In this case, we would find that 57% of the connections are
COVID related (which would drop to 45% if we considered only established
researchers). Hence, COVID has lead to significant new collaborations,
while at the same time accessing a large proportion of the existing
collaboration network.
Ironically, this is precisely
the type of thinking that disease modellers and epidemiologists would
use in agent-based models to study the spread of a disease. In this
case, the disease would be ‘doing research into COVID’, exposure would
start with reading something in the media or in the research literature,
infection would be starting research, and recovery would be publishing a
paper. Indeed, understanding the sociology of research that is emerging
from the COVID microcosm might well benefit from disease modelling
techniques.
3.3 Gender Imbalances
In
this final section of the analysis, we look at how typical gender roles
have impacted the sociology of scholarly communication during the
emergence of the COVID period. Recently, this topic has come to the
forefront of the scholarly communication discussion (Donald, 2020; Matthews, 2020; Minello, 2020)
In the analysis that follows, we have chosen to use first co-authorship
as a means by which to benchmark the level of gender bias in the
research environment. Of course, it can only be a proxy and cannot
possibly give a complete picture. In addition, there are many fields
that publish co-author names alphabetically and our analysis would not
be valid in those fields. However, rather than attempt to quantify a
very uneven landscape, we have assumed that alphabetic ordering is
either in a minority or does not overly skew our results.
Figure 12 summarizes the impact on the equality of gender represented in publications during the opening months of 2020.
Again, for this analysis, the ability of Dimensions
to supply timely data that allows a real-time month-by-month analysis
is insightful in drawing conclusions regarding sociological issues in
research. In this case, the result is marked. During the COVID period,
lockdowns have been implemented around the globe. COVID lockdowns have
become a target of significant academic study in their own right: the
mental health implications, as well as the impact on different countries
and different social strata are not only interesting from an academic
standpoint but critical to inform policy. Closer to academic research
itself, we can see an immediate manifestation of lockdown emerging
clearly in Figure 12.
Throughout
the first three months of this year, countries entered a period of
lockdown. In the case of China, lockdown started to be introduced in
February. By the end of March, a significant proportion of China, Japan,
much of Europe, the United Kingdom, and the US were all in lockdown.
Effects of the lockdown included researchers being unable to access
their facilities in their institutions (unless they were directly work
on vaccine-related COVID research). It also lead to the closure of
schools. Many researchers took the opportunity to write up and complete
previous papers, leading to an overall rise in the papers received by
publishers. More than 90% of researchers claimed that COVID had impacted
their ability to conduct their research to some extent and that they
would need to rely on existing data that they had already harvested from
their experiments to continue their work (Nature, 2020). However, the burden of the closure of schools appears to have fallen disproportionately on women. Figure 12
shows a clear signal for this conclusion as the number of female first
authors decreased markedly just following the beginning of the most
extensive phase of lockdown in March. An effect that we see gradually
reducing as schools gradually reopened in June or a “new normal” began
to emerge. We speculate that this decrease in female first authorships
is a direct result of the closure of schools around the world. The main
body of the world's research continues to be produced in the US, China,
United Kingdom, Germany, France, Italy and Spain. These were all
countries that were heavily affected by COVID and which imposed
lockdowns that included school closure. They are all societies in which
there is a tradition of females having the principal responsibility for
raising children. While this trope has been hidden to some extent by
progressive policy choices, there is clearly a continuing imbalance that
emerges from the data in the simple analysis presented here.
4 Discussion
As
with any analysis that has been carried out at the time at which a
sociological effect is developing, the insights shared in this paper are
very much of the period in which they were generated. They lack the
“wide-angle lens” of history or the much more considered analyses that
will come. The analyses contained in this paper are also specifically
not designed to be cutting-edge bibliometrics analyses, and this would
then focus the reader on the nature of the analyses rather than the
capabilities of the data source that is powering those analyses.
Dimensions
and other resources that follow similar approaches focus on providing a
data to empower researchers and analysts to ask questions and then to
use technology to move more quickly to analysis and interpretation
rather than on gaining access to data. In previous work, we have
described the nature of the Dimensions data system, focusing on
the interlinking of different data types, data enhancements, and the
use of persistent identifiers. We have also spoken about the ethos of
building the system and the values behind it Hook et al. (2018); Herzog et al. (2020). However, the COVID-19 crisis has highlighted a combination of features of Dimensions
that suggest a new style of analysis is not only possible but
potentially valuable, and which may even be required to better support
objective decision making in an era of increased uncertainty.
Many
bibliometric analyses have the advantage of time: that distance from an
event that provides the ability to take a longer view. This is
well-matched to an analysis that can consider data from years rather
than months or weeks. Yet, in the face of the COVID-19 crisis is it
precisely an analysis over months and weeks that is required to be able
to track trends and to prepare well-informed policy and responses to
policy. We refer to this approach to analysis as “real-time”
bibliometrics. While it is clear that this approach has significant
limitations in the perspective it can bring, we believe that is can also
be seen as a useful tool in helping to pinpoint, quantify and respond
to trends as they happen, for all stakeholders in the research
ecosystem.
The enablers of real-time bibliometrics
that we have observed from doing the analyses contained in this study
are: i) the use of technology that can allow data to be extracted and
enhanced without the need for human curation of individual records
(rather human curation should focus on activities that improve inputs to
algorithms); ii) swift updates to data enabled by i); iii) the
automated application of categorization at a per-object level; iv) an
inclusive approach that makes a broad range of data types and fields
available for study; v) full-text searching that allows maximal freedom
to explore data; vi) technologies that facilitate programmatic access
and manipulation of data. This is not an exhaustive list of features,
but these are the ones that emerge from the analysis performed both in
the current paper and in (Hook et al., 2020).
It
remains unclear whether real-time bibliometrics is something that is
either valuable in a general context or, indeed, would be an advisable
route from either bibliometricians or scientometricians to follow. One
should clearly be cautious before deploying such technological
approaches as these in a policy environment since the perception of an
active measurement or overly active feedback mechanism can have negative
social effects or drive unwanted behaviors Goodhart (1981); Strathern (1997).
However, the current authors believe that developing a greater
understanding of the potential for real-time analyses and their
potential impacts should be of broad academic interest and may
eventually find a role in policy formulation. Defining “real-time
bibliometrics” in a more rigorous and well-structured manner, broadening
the range of tools that are available to researchers and analysts, as
well as identifying pitfalls, challenges and undesirable effects of this
style of analysis would be of general value.
Data Availability Statement
The
datasets presented in this study can be found in online repositories.
The names of the repositories and accession numbers can be found below: 10.6084/m9.figshare.c.5092994.
Author Contributions
Ideas
for this article were generated and refined by DH, SP, and CH. Data
analysis for this article was performed by SP and HD. Interpretation of
analysis was performed by all co-authors. The article was drafted by DH
and all authors collaborated on editing the article and responding to
referee comments.
Conflict of Interest
All co-authors of this paper are employees of Digital Science, the creator and provider of Dimensions.
Acknowledgments
The
co-authors would like to thank Digital Science's Data Science team,
specifically, Ian Calvert, for his support in extracting data for
several of the analyses contained in this paper.
Footnotes
1While analyses of all of these different object types is not included in the current paper, further examples may be found in (Hook et al., 2020).
References
Brainard, J. (2020). Scientists are drowning in COVID-19 papers. Can new tools keep them afloat? Science doi:10.1126/science.abc7839
CrossRef Full Text | Google Scholar
Carden, G., and Young, L. (2020). Beyond the Pandemic: the role of universities in shaping a better future. HEPI LibraryAvailable at: www.hepi.ac.uk (Accessed May 8, 2020).
Google Scholar
Chiarelli,
A., Johnson, R., Pinfield, S., and Richens, E. (2019). preprints and
scholarly communication: an exploratory qualitative study of adoption,
practices, drivers and barriers. F1000Research 8, 971. doi:10.12688/f1000research.19619.2
PubMed Abstract | CrossRef Full Text | Google Scholar
Colavizza,
G., Costas, R., Traag, V. A., van Eck, N. J., van Leeuwen, T., and
Waltman, L. (2020). A scientometric overview of CORD-19. Scientific
Communication and Education [Preprint]. Available at: https://doi.org/10.1101/2020.04.20.046144 (Accessed December 1, 2020).
Google Scholar
Donald, A. (2020). The disproportionate effect of Covid-19 on women must be addressed. Times Higher Education (THE).
Google Scholar
Fraser,
N., Brierley, L., Dey, G., Polka, J. K., Pálfy, M., and Coates, J. A.
(2020). Preprinting a pandemic: the role of preprints in the COVID-19
pandemicCold. spring harbor laboratory section: new results. bioRxiv. doi:10.1101/2020.05.22.111294
CrossRef Full Text | Google Scholar
Frey, C. B. (2019). The technology trap. Princeton, NJ: Princeton University Press.
Google Scholar
Fry,
C. V., Cai, X., Zhang, Y., and Wagner, C. (2020). Consolidation in a
crisis: patterns of international collaboration in COVID-19 research. SSRN Electron. J. doi:10.2139/ssrn.3595455
CrossRef Full Text | Google Scholar
Goodhart, C. A. E. (1981). “Problems of monetary management: the U.K. Experience,” in Inflation, depression, and economic policy in the west, 111–146.
Google Scholar
Herzog, C., Hook, D., and Konkiel, S. (2020). Dimensions: bringing down barriers between scientometricians and data. Quant. Sci. Studies 1, 387–395. doi:10.1162/qss_a_00020
CrossRef Full Text | Google Scholar
Hook, D. W., Porter, S. J., and Herzog, C. (2018). Dimensions: building context for search and evaluation. Front. Res. Metrics and Analytics 3. doi:10.3389/frma.2018.00023
CrossRef Full Text | Google Scholar
Hook, D., Porter, S., and Porter, S. (2020). How COVID-19 is changing research culture. Report. Digital Science doi:10.6084/m9.figshare.12383267.v1
CrossRef Full Text | Google Scholar
Johansson, M. A., and Saderi, D. (2020). Open peer-review platform for COVID-19 preprints. Nature 579, 29. doi:10.1038/d41586-020-00613-4
CrossRef Full Text | Google Scholar
Kiley, R. (2020). Open access: how COVID-19 will change the way research findings are shared.
Google Scholar
Kundu,
S. (2020). Chinese Academy of Sciences (CAS) recommends Dimensions for
making latest research on COVID-19 openly discoverable. Dimensions blog.
Google Scholar
Jacomy,
M., Venturini, T., Heymann, S., and Bastian, M. (2014). ForceAtlas2, a
continuous graph layout algorithm for handy network visualization
designed for the Gephi software. PloS One 9, e98679. Publisher: Public Library of Science. doi:10.1371/journal.pone.0098679
PubMed Abstract | CrossRef Full Text | Google Scholar
Matthews, D. (2020). Pandemic lockdown holding back female academics, data show. High Educ.
Google Scholar
OASPA (2020). COVID-19 publishers open letter of intent—rapid review—OASPA.
Google Scholar
Strathern, M. (1997). “Improving ratings”: audit in the British University system. Eur. Rev. 5, 305–321. doi:10.1002/(SICI)1234-981X(199707)5:3(305:AID-EURO184)3.0.CO;2-4
CrossRef Full Text | Google Scholar
Suominen,
A., and Toivanen, H. (2016). Map of science with topic modeling:
comparison of unsupervised learning and human-assigned subject
classification. J. Assoc. Inform. Sci. Technol. 67, 2464–2476. doi:10.1002/asi.23596
CrossRef Full Text | Google Scholar
Torres-Salinas,
D., Robinson-Garcia, N., and Castillo-Valdivieso, P. A. (2020). Open
Access and Altmetrics in the pandemic age: forescast analysis on
COVID-19 literature. Scientific Communication and Education [Preprint].
Available at: https://doi.org/10.1101/2020.04.23.057307.
Google Scholar
Viglione, G. (2020). Are women publishing less during the pandemic? Here’s what the data say. Nature doi:10.1038/d41586-020-01294-9
CrossRef Full Text | Google Scholar
Zhang,
Y., Zhang, G., Chen, H., Porter, A. L., Zhu, D., and Lu, J. (2016).
Topic analysis and forecasting for science, technology and innovation:
methodology with a case study focusing on big data research. Technol. Forecast. Soc. Change 105, 179–191. doi:10.1016/j.techfore.2016.01.015
CrossRef Full Text | Google Scholar


 Daniel W Hook
 Simon J Porter
 Hélène Draux
 Christian T Herzog