In order to improve the quality of systematic researches, various tools have been developed by well-known scientific institutes sporadically. Dr. Nader Ale Ebrahim has collected these sporadic tools under one roof in a collection named “Research Tool Box”. The toolbox contains over 720 tools so far, classified in 4 main categories: Literature-review, Writing a paper, Targeting suitable journals, as well as Enhancing visibility and impact factor.
Do
you know “Over 43% of ISI papers have never ever received any
citations?” (nature.com/top100, 2014). Publishing a high quality paper
in scientific journals is only halfway towards receiving citation in the
future. The rest of the journey is dependent on disseminating the
publications via proper utilization of the “Research Tools”. Proper
tools allow the researchers to increase the research impact and
citations for their publications.
Are you a researcher working on text-based projects? Ever tried
to make sense of all those social media posts, or analyse a long and
complex literary text? Wrangling large volumes of text can be a
challenge, so in this post Kim Doyle introduces text mining concepts and tools to make this task easier.
Getting started
Text mining (also known as text data mining or text analytics) is a
broad name for a number of processes and practices that gather and
examine large collections of written resources to discover new
information or answer a specific research question. Typically, this
analysis begins with information retrieval, which involves the
identification of relevant textual materials in a file, database, on the
Web, or in some other digitised format. Automated analysis is performed
by specialised computer software to structure text for analysis, derive
patterns from the resulting data, and interpret the output. One of the
most common and important methodologies for processing text is Natural
Language Processing (NLP). It can be used to extract precise
information, analyse meaning, classify text, find relevant entities and
relationships in language, and more.
That Thing you do: integration into practice
Where to get data?
Text data can be gathered and processed from a wide variety of
sources, including documents, books, digital archives, library
catalogues, websites, and social media streams like Facebook and
Twitter, or any combination of these. The format these sources are
stored in will determine data acquisition techniques. In many cases you
may already have your data, or be able to simply download text files
from a repository. However, if you want to harvest data from the Web,
you may need to connect to an Application Programming Interface (API)
or perform Web scraping, especially if you are interested in social
media data. This may require programming skills, depending on the scale
and scope of the data collection.
The size and structure of the data will determine the most
appropriate textual analysis techniques. Small datasets might not be
appropriate for computational analysis. Some statistical techniques,
such as topic modelling, require large amounts of data to produce
meaningful results. Beyond the size of the data, the methods of analysis
will be determined by your research interests. It is important to make
sure methods are appropriate both for the size and structure of the
data, but also that they are able to answer your research questions.
Some examples of computational techniques include:
Working with data-driven techniques, software packages, and
programming tools can be a steep learning curve. Below are a few tools
to get you started. The Web-based tool Voyant is a good introduction to
text mining and can address many research questions. On the other end of
the scale, programming tools such as Python and R are customisable, but
can be intimidating at first glance. Below are introductory texts for R
and Python written specifically for simplified text mining. Orange Text
Mining uses a graphical user interface to create workflows to analyse
text. You will find a range of introductory videos on its website.
The data, tools and techniques you use should be documented in your Data Management Plan.
This will help you conceive your data project, keep good documentation,
and maintain your data for future research in accordance with the
University’s data retention policy. As always, when using these
analytical tools to analyse your data (especially those tools only
available online), you must carefully consider the potential privacy
risks, and what measures will be needed to mitigate those risks (e.g.
making personal or sensitive data anonymous). For privacy, ethics and
security issues, it is strongly recommended to contact experts from the
University’s Office of Research Ethics and Integrity
prior to using any of these online tools. In some cases ethics approval
should be sought before data collection (Facebook data, for example)
and this should be factored into project timelines.
Learn more
The depth of this topic means only a small fraction of available text
mining tools and processes are covered here. There are certainly other
options that might be worth considering depending on your specific
requirements and research questions. If you are keen to delve deeper and
learn some coding, Natural Language Processing with Python is a good introduction to concepts in NLP and writing programs, regardless of previous programming experience.
Where to get help
If text mining is something you’re considering in your research,
there are a couple of places within the University that can help:
Digital Studio.
The Digital Studio provides a range of services and infrastructure to
support University researchers, professionals, and selected industry
experts and students working on digital projects in the humanities,
arts, and social sciences (HASS).
Social and Cultural Informatics Platform (SCIP).
The SCIP team work as a part of the Faculty of Arts Digital Studio and
work closely with Melbourne Graduate School of Education (MGSE) and
their research support staff. SCIP partners with the Digital Studio and
MGSE to support research, raising awareness, digital research practice,
and training and workshops.
Research Computing Services (RCS).
RCS offers specialised computing services to researchers including
infrastructure such as the Melbourne Research Cloud and free digital
skills training. Upcoming training in Python, R and many other tools can
be found on their eventbrite.
About the author
Kim Doyle is a Research Data Specialist at the Melbourne Data Analytics Platform (MDAP)
and a PhD in Media and Communications at the University of Melbourne.
Previously, she taught natural language processing and data mining to
researchers at the University of Melbourne’s Research Computing Services
for a number of years. Her research interests include political
communication, social media, and computational social science.
Want more from 23 Research Things? Sign up to our mailing list to never miss a post.
Data visualisations can be a powerful way of synthesising your
research and representing it in a way that’s understandable.
Visualisations may take the form of charts or graphs, diagrams, images,
animations, or infographics. They can be effective for communicating
complex research, even to a non-expert audience. In this post, Gene Melzack introduces data visualisation as a way to make your research more accessible.
Getting started
Data visualisation is closely tied to data analysis. You may want to
perform some preliminary visualisations at the start of your analysis,
as a way of getting to know the data and deciding what analysis methods
to use (also known as ‘exploratory data analysis’). Research workflows
may involve receiving updates to data or refining your analysis, which
means you’ll need to update your visualisation in turn. If you can do
all this with a single tool that handles both analysis and visualisation
in one, it will streamline your workflow. Consider data visualisation
capabilities when selecting a data analysis tool, as it could save you
time and hassle later – even if it means initially choosing a tool with a
steeper learning curve.
Considerations
Before you dive in and choose a visualisation tool, you’ll need to consider the following points:
Audience
Is the visualisation a ‘quick and dirty’ one just for you, or is it
for communicating your research to peers in the scholarly community, or
to the public? This may influence whether you choose a simple or more
complex visualisation.
Data
Different types of visualisation suit different types of data. With
so many options available, choosing the right visualisation style can
seem overwhelming. For example, do you want to go with a network diagram
or a bubble map? Or maybe a boxplot, or a cluster analysis?
Is the visualisation for a conference presentation, journal article,
or an interactive web visualisation? This will affect how the
visualisation is displayed: in print or online, static or active, in
colour or grayscale.
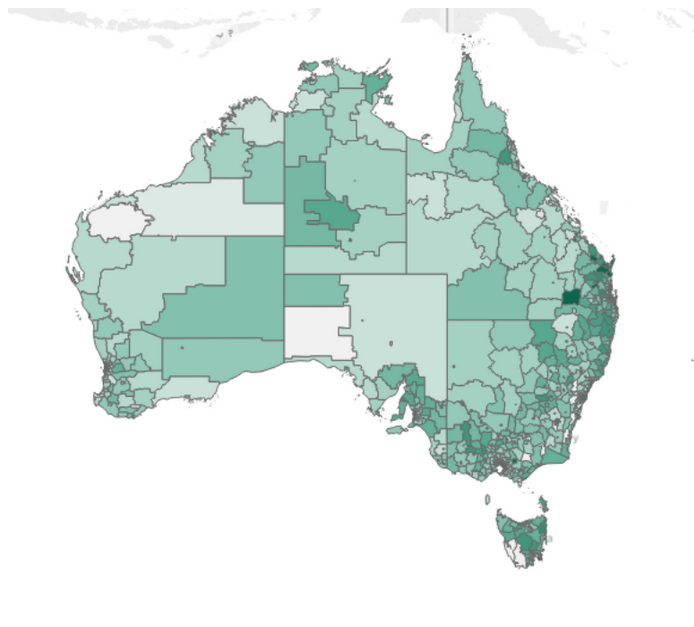
For an example of data visualisation in practice, click on the image below to explore an interactive map of Census data:
Image
from Zhou, Qingsheng; Llewellyn, Gwynnyth; Emerson, Eric; Badland,
Hannah; Stancliffe, Roger (2019): Spatial distribution of working age
adults with disabilities across Australia: a small area analysis of the
2016 Census. University of Melbourne. Dataset.
https://doi.org/10.26188/5c75f384c4502
Tools
We’ve already established that, in most cases, the best approach is
to visualise your data with the same tool you use for your data
analysis. For example, if you analyse your data with MATLAB, consider
using the inbuilt graphics functions for visualisation. Or if you use NVivo for data analysis, explore its visualisation options for Windows and Mac.
If you use scripting languages such as R or Python for data analysis,
then there are a variety of packages or libraries you could choose.
Here are some that come recommended by researchers who specialise in
data analysis and visualisation:
Seaborn. A data visualisation library for Python, based on matplotlib.
Plotly. An interactive graphing library for Python; also available as libraries for JavaScript and R.
ggplot2. R package for creating graphics from the tidyverse. Integrates with Plotly.
Do you want to develop your visualisation skills? Access online
trainings, self-paced tutorials, and e-learning videos with the Research
Computing Services’ Digital Research Skills Support Pack. Or check out the Researcher@Library session on ‘How to Create Research Impact with Data Visualisation and Infographics’.
In recent years there has been shift away from ‘traditional’
impact metrics (such as citation counts), in favour of an increased
focus on identifying and assessing the real-world impact of research.
This is often referred to as the ‘impact agenda’. In this post Kristijan Causovski, Justin Shearer, and Joann Cattlin investigate different types of impact, and how integrate them to into your research workflows.
Getting started
The Australian Research Council (ARC) defines research impact
as ‘the contribution that research makes to the economy, society,
environment or culture, beyond the contribution to academic research’.
While the nature of impact varies across disciplines and research
methodologies, there are a number of broad categories through which to
achieve impact:
Instrumental impact, which is direct impact on policy and practice decisions.
Conceptual impact, which is impact on knowledge, understanding, and attitudes of policymakers and practitioners, and wider stakeholders.
Capacity-building impact, such as education, training, and skills.
Connectivity between researchers and users
subsequent to a funded piece of work: they may stay in touch, visit, and
perhaps work together, enhancing the likelihood of internalisation of
research findings and thus impact.
Changes in attitudes towards knowledge, knowledge exchange and research impact more broadly.
In Australia, research impact has become a requirement of some funding bodies. The National Health and Medical Research Council (NHMRC) and Medical Research Future Fund grants are introducing requirements for research translation and impact plans, while ARC grant applications now require a national interest statement. The ARC also assesses universities periodically through the Engagement and Impact assessment exercise, and engagement is part of the mission of many universities (e.g. Advancing Melbourne 2030).
Researchers should consider how their research project or program can
inform, benefit or provide value beyond academia and address this in
their project plan.
That Thing you do: integration into practice
Engaging your stakeholders
A good, healthy stakeholder relationship is one of the most effective
ways of creating impact. You can achieve this by planning engagement
activities as part of a research project involving those who could be
potentially affected by, use, or be interested in, the research
outcomes. Engagement can take the form of:
Collaboration and co-produced research through
partnerships with community members, business, industry or government.
Collaboration is a two-way process where the exchange of information
between researchers and stakeholders generates new knowledge.
Dissemination and communication of research, using a
variety of tools and mediums to reach different types of audiences.
This can include social media and websites, briefings, podcasts, videos,
meetings, and plain language material.
It is important to build evaluation mechanisms into your engagement
activities so you can determine whether you are having an impact, and
what the impact is. Evaluation can involve surveys, interviews, data
collected from website hits and social media activity (altmetrics), emails and communications from stakeholders, as well as academic citations. Creating a plan for evaluation
means that you are well prepared to collect and analyse this
information, and you can adapt your approach as you conduct the
research.
Bibliometrics
Various statistical methods
are used to analyse authors, publications, and topics, often to measure
their impact within a portfolio or subject area. Evaluation of research
impact and engagement should be a balanced judgement,
comprising an interpretation by peers in conjunction with research
metrics, rather than a predominant or exclusive reliance on the latter.
The metrics below are commonly used examples to provide supporting
evidence for grant or promotion applications:
Article-level metrics refer to a variety of
measures that provide insight into the reach of individual articles.
Citation counts and alternative metrics such as downloads, views and
media/social media mentions are examples of article-level metrics. Web of Science, Scopus and Google Scholar
are commonly used as a source for citation counts, but the results from
each database may be different as these counts are dependent on the
indexed publications.
Journal-level metrics aim to measure the influence
of a journal. There are many journal-level metrics based on different
methods of calculation and datasets. The Web of Science impact factors and Scopus journal metrics
(CiteScore, SJR and SNIP) are commonly-used measures or rankings of
purported journal quality, which rely on the number of citations the
journal has received in Web of Science and Scopus respectively.
Author-level metrics such as such as the h-index
try to measure the academic impact of individual researchers. A
researcher’s h-index can be calculated manually by locating citation
counts for all published papers, and ranking them numerically by the
times cited: a researcher has an index of h if h of their papers have
been cited at least h times each.
Alternative article-level metrics (altmetrics) are
complementary to the “traditional” metrics provided by citation counts.
They are based on online activity, mined or gathered from online tools
and social media (e.g. tweets, mentions, shares or links).
It is important to note that not all indicators are suitable for all
disciplines. Differences in scholarly disciplines and individuals’
career pathways need to be factored into assessment. For example, the
aforementioned h-index is well known to disadvantage early-career
researchers (as the h-index can only grow over time), those with
non-traditional career pathways, or those in low-citation count
disciplines. Similarly, the journal impact factor is often used as an
ersatz article-level metric – a purpose for which it is not intended.
The best practice approach is to use a variety of indicators and only
use them as part of an evaluation discussion to inform the conversation.
No indicators are perfect.
In recognition of the challenges presented by the impact evaluation
landscape, the University of Melbourne is a signatory to the San Francisco Declaration on Research Assessment (DORA) – an initiative created with the aim of improving the ways in which the outputs of scholarly research are evaluated.
Kristijan Causovski is Digital Preservation
Coordinator and Liaison Librarian, Business and Economics, Scholarly
Services, at the University of Melbourne.
Justin Shearer is Associate Director, Research Information and Engagement, Scholarly Services, at the University of Melbourne.
Joann Cattlin is Manager, Research Engagement & Impact, Melbourne Law School.
Want more from 23 Research Things? Sign up to our mailing list to never miss a post.
Taking some time to manage your online presence as a researcher
can make you more visible to the people who need or want to know about
you. How would a recruiter, principle investigator, journalist or
conference organiser know how to find you? Having a plan to manage your
online visibility is a good idea, so in this post Christina Ward and Dr Trent Hennessey give you some tips to avoid this task becoming overwhelming.
Getting started
Check yourself – start with an audit
If you aren’t googling yourself, someone else certainly is. To find
out if you’re discoverable online – and in fact, what a search about you
would uncover – you can replicate someone else’s experience by
searching from a private browser. This will ensure your results aren’t
skewed by your online history or signed in accounts. Try using more than
one search engine, as results and rankings may be different. You might
find you have a ‘digital doppelgänger’, that is, someone with the same,
or similar, name. This doppelgänger may obscure your work, or your
search may uncover some past online activity that you no longer want to
highlight. Understanding your digital footprint can help you prioritise
what to clean up and how to distinguish yourself when setting up your
own profiles: for example, you may wish to use a variant of your name,
like including your middle initial.
Recognising there are diverse research cultures and communities, it
can be particularly useful to search for some of your peers, or
researchers whose paths you would like to follow. What kind of web
presence do they have? Which platforms are commonly used by researchers
in your field? These quick searches will give you a good idea of the
best channels and platforms for your discipline. It will also allow you
to be more targeted with building and managing your visibility.
That Thing you do: integration into practice
Now you know what the state of your online visibility is, let’s have a look at how to actively manage and promote yourself.
Researcher profiles – you do you
Researcher profiles are publicly accessible pages that give details
of your scholarly achievements, including publications, grants,
affiliations, and qualifications. They can provide current contact
details, or links to portfolios or social media, making it easy to reach
you even if you’ve moved institutions or changed your name.
Some platforms, such as Google Scholar or Scopus,
may auto-generate a page for you based on the information held in their
database. You’re not required to manage these pages, but if you choose
to claim them, you can clean up the results by removing duplications or
errors, so that the information is accurate.
For the most part, you can choose which platforms you engage with. However, all University of Melbourne research students and academic staff are required to have an ORCID (Open Researcher and Contributor ID). Your ORCID is a 16-digit number which is unique to you and connects with the University’s publications management system, Minerva Elements (a unimelb log-in is required to access Minerva Elements).
Many profiles will automatically update with your latest articles.
They will also allow you to track citations that your research
outputs have received.
How do I choose?
The Researcher Profiles, Identifiers and Networks
Library Guide will give you an overview of commonly-used profiles and
their key features, as well as guidance on setting them up. Before
making a choice, consider the following:
Who am I trying to reach? Some profiles can only be viewed by people within academia; others, like LinkedIn, are generalist and popular in industry.
Does the service have enough flexibility to highlight my work? What
kind of contributions can you include – traditional academic outputs or
broader contributions? If your discipline showcases their work
elsewhere, e.g. github profiles or online portfolios, can you link out
to these pages?
Do I need to limit my exposure for any reason? Do
you have safety considerations to work with? Does the platform offer
privacy controls and considered moderation? Are some platforms hostile
to particular areas of research or demographics?
Considerations
A profile is for life, not just for completion
Keeping your profiles current signals to the world that you’re still
an active part of your research community, making you a more attractive
option to contact, for example if your topic is in the news and someone
wants a comment or interview.
Remember to update your profile when you:
Have a new publication, award or conference presentation.
Change institution, name, or contact details.
Are looking for new opportunities.
Managing your visibility requires ongoing work, and taking time at
the outset to plan your approach will help you get the balance
right. Consider which profile/s will be truly beneficial to you,
then focus on keeping these up to date. This will be much more effective
than setting up multiple profiles, but not maintaining any of them.
About the authors
Christina Ward is a Liaison Librarian in the Law Library.
Dr Trent Hennessey is Program Manager of
Environments and Experience in Scholarly Services. Trent is
a strong advocate for lifelong learning, literacies, and libraries,
understanding their transformative power to improve lives and develop
knowledge societies globally.
Want more from 23 Research Things? Sign up to our mailing list to never miss a post.
Thing 10: Using Social Media to Promote Your Research
Social
media can be a powerful tool for networking and raising your research
profile. Its conversational style fosters open, informal professional
connections and enables engagement with broader communities of interest. In this post, Andrea Hurt and Lisa O’Sullivan introduce the ‘big three’ social media platforms: Twitter, Facebook, and Instagram.
Getting started
The way that researchers use social media is constantlyevolving.These channels provide platforms to help build a public presence for you and your work. They can also help combat the sense of isolationsomeresearch students feel.Many research organisations also have own social media accounts, which often aim to present
a more personal side to a corporate face. Whether it’s your own social
media account or an institution, the primary function is to build relationships.
Firstly, consider why you are interested
in social media and who you hope to engage with. Are you focussed on
raising your own profile or creating a community? Do you hope to connect
with others within your subject area, build more interdisciplinary
connections, or share tips about the research process? Understanding
your “target audience” will help you decide which platform(s) to use and when, how, and what you post.
That Thing you do: integration into practice
Twitter
With its 280–character limit, Twitter is a great platform to use to hone your skills in describing your interests in a succinct
and engaging way. It’s probably the best social media platform for
generating conversations and keeping up-to-date with what’s happening in
your discipline or interest area.
Your academic status is not important on Twitter; you
can use it to follow researchers or share and publicise your own work.
You’ll also find many institutions using Twitter as a key promotional
tool for their work. Perhaps most powerfully, you can use it to connect with other researchers and build a community.
Get tweeting!
Tweeting only when you have something to say, creating a consistent presence, and responding to others on the platform can all help you build your presence. Start by following people and organisations in your field and have a look at who they’re following as well. Using videos, well-known hashtags, and live tweeting events of interest can also be useful ways to get your content noticed.
Twitter allows threads to link longer stories together; but remember that each tweet can also be shared by itself, so make sure your tweets make sense in isolation. Remember that you will be tweeting to a global audience and be aware of cultural and linguistic differences.
Twitter Analyticscan help you see the impact and reach your tweets are having, as well as information about your followers.
What others have tried
Some examples from the UniMelb community
demonstrate the kind of identities you’ll find on Twitter that straddle
the professional and personal in different ways:
@indiglang The
Research Unit for Indigenous Language. This Academic Unit shares news
and resources based on their research. No named contributors.
@UniMelbscicomm The Science Communication Unit, with individuals identified and both students and staff contributing content.
@UnaMcIlvenna Dr Una McIlvenna, Senior
Lecturer in History “who writes about – and sometimes sings – songs
about public execution from the 16th century to the 19th century”.
@MelbournePollen Information channel, with pollen Counts and forecasts for the Melbourne area.
@Kobotic Research Fellow in Digital Ethics, tweeting about her research and personal interests (including dachshunds).
Facebook
Facebook is the most popular social media platform in Australia, with 16,000,000 monthly active Australian users (May 2020). Its popularity,ease of sharing information, and ability to create a space for conversation means it’s a channel for engagement and interaction. Don’t assume that the general public won’t
be interested in accessing your research and sharing your interests! A
surprising number of people love to hear about the nitty gritty of doing
all kinds of research. Rather than boosting your personal profile, consider Facebook for creating audiences in two key ways:
Create a page that shows your area of interest or represents an organisation.
Facebook Live offers real-time video streaming, enabling viewers to comment and ask questions.
Facebook Stories enables photos, videos and posts that will only be visible for 24 hours, but can be archived later.
Facebook Events helps promote
talks, functions, launches, exhibitions or any public event. It allows
followers to register interest and Facebook will remind people as the
event gets closer.
You can measure your impact and success in different ways: the number of likes,
the number of conversations generated, and the quality of interactions.
If you’re running a Facebook page, you will have access to Facebook Insights, which is their free analytics service.
Facebook also has a Research and Outreach area, providingfellowship opportunities, research collaborations, research awards and visiting opportunities to work on projects.
Originally designed as a photo sharing platform, Instagram is now the third most popular social media channel, with 9,000,000 monthly active Australian users (May 2020). Instagramalsoallows for video sharing in your feed, via Instagram Stories,and through the new IGTVapp.
Images lend themselves to storytelling, drawing the
viewer into the work you do. Some accounts focus solely on research or a
specific subject, while others blend the personal and professional. The
visual diary aspect of Instagram allows followers to see all elements
(work, study, social, family) of your life. And remember that humourcan be a great way to get people to engage with your account.
Insta insights
You can choose a personal or business Instagram account.
Following
people is a good way to start seeing how other people are creating
content for this platform. You can also follow specific hashtags – and
start using them in your own posts. This will make you more
discoverable.
If you have other social media accounts, it’s good to try and keep your usernames the same, especially for business accounts.
Fill out your biography – it should be short, informative, and give people an idea about who you are and what you’re likely to be posting.
Instagram
is now owned by Facebook, and introduced an algorithm overriding the
original chronological order of posts. Here are some tips on ensuring your posts get seen.
Basic analytics, called Insights, are available with the business account, giving information on followers and engagement and impressions on your posts.
Instagram has introduced sponsored posts;find out more about Instagram Ads.
Be realistic about what you want from being on social media, and the time you have available to build and maintain a consistent presence.
Decide on the boundaries of your social media presence:some
people are comfortable posting professional and personal news from the
same account, while others prefer to keep them strictly separate. You may have accounts representing you,your research, or your institutions’ work; in each case, the content you post may have a different tone and focus.
Be aware of etiquette around tagging others andposting information or imagesthat might infringe on others’ privacy. Also be conscious of your personal liability for any material you post or share.
While social media posts can feel ephemeral, remember that once something is on the internet it can be difficult to erase. Many recruiters now openly search candidates’ social media accounts,so be thoughtful about what you post, especially on a platform like Twitter where posts can easily be shared and taken out of the context you intended.
Learn more
This guide from
Newcastle University explored why you might want to use Twitter during
your PhD and supplies lots of useful links to Twitter lists and
discussions about academic tweeting.
URL shorteners such as https://bitly.com/ or go.unimelb save characters and can be used to share links without using too many letters or numbers.
A useful “myth-busting” piece from UNSW provides advice on personal liability when posting on social media platforms.
This guide from the University of Sydney summarises more of theother social media platforms available and some of their strengths in helping you promote your work.
Altmetrics can measure the impact of mentions via social media. The Library has a guide explaining how to use alternative metrics software. The University has more information about terms of service for social media, and discusses academic freedom.
About the authors
Andrea Hurtis
focussed on outreach and the user experience. People and spaces are her
priority as the Senior Librarian, Library Services and Spaces in the
Baillieu Library. With over 30 years’experience,
she has grown up in academic libraries. Andy is a lover of social
media, digital communication, and spends a lot of time on Instagram. She
is also the Library Social Media Coordinator. Andy is currently
studying a Master of Communication with a specialisation in Digital
Media.
Lisa O’Sullivantrained as a historian and has worked in archives, museums
and libraries, particularly those relating to the cultural history of
medicine and the natural sciences. In her current role she focuses on
engagement and outreach for the Archives and Special collections of the
University. She lurks on Twitter for most of her personal and
professional news.
Want more from 23 Research Things? Sign up to our mailing list to never miss a post.