Monday, 30 March 2015

Scopus added ‘Export list to SciVal’ feature

 Source: http://communications.elsevier.com

Scopus added ‘Export list to SciVal’ feature

On
March 25, Scopus added the ability to directly export a list of Scopus
documents to SciVal, Elsevier’s benchmarking and analytics product
allowing the user to turn them into a publication set in SciVal.
Available to users with access to both products, the Scopus to SciVal
export feature reduces the number of steps when using the two products
together.
This new feature further increases the interoperability between Scopus and SciVal, both products within the Elsevier Research Intelligence portfolio.


Here is how the Scopus to SciVal export works:

Step 1: Enter your search in Scopus.

Step 2: From your search results, select the desired documents and add them to your Scopus list.

Under ‘More,’ select ‘Add to My list’.

image1

Step 3: From ‘My list, you will now see the option to ‘‘Export your list to SciVal’

image2

Step 4: Once
you select documents and click on this icon, a pop-up screen will appear
asking if you want to ‘Continue to SciVal’. Selecting this
automatically re-directs you to SciVal:


Step 5: Next,
you have the option to save the Scopus results list. Once saved, this
list is automatically added to ‘Publication Sets’ in the SciVal
‘Benchmarking’ module. This module provides you with advanced
capabilities to perform further in-depth analysis using the exported
Scopus results.

image4


Note: The Scopus ‘Export to SciVal’ option can export up to 2,000 documents and can only be used for post-1995 data.
Read our blog post for more information.
Best regards,


The Scopus Team


Scopus added ‘Export list to SciVal’ feature

MK-index: A measure of discrepant social media profile for scientists

Modified Kardashian index (MK-index): A measure of discrepant social media profile for scientists

Nader Ale Ebrahim, Research
Support Unit, Centre for Research Services, Institute of Research
Management and Monitoring (IPPP), University of Malaya, Malaysia


Abstract

This study propose a “Modified Kardashian index” (MK-index), a
measure of discrepancy between a scientist’s publication record and
social media based on the Hall (2014) K-index. A direct comparison of
numbers of citations on Google Scholar and Twitter followers, are used
to measure the MK-Index.


Suggested Citation

Nader Ale Ebrahim. 2015. "Modified Kardashian index (MK-index): A measure of discrepant social media profile for scientists" The SelectedWorks of Nader Ale Ebrahim
Available at: http://works.bepress.com/aleebrahim/98

"Modified Kardashian index (MK-index): A measure of discrepant social m" by Nader Ale Ebrahim

Introductory Workshop on Strategies to Enhance Research Visibility, Impact & Citations


Dear
Campus Community
,
Centre for
Research Services (PPP) will organize a series of  Round- the-Campus
workshops on "Research visibility enhancement and citation
improvement"
  to UM community especially those who are newly
recruited. The purpose is to create awareness and to introduce effective ways
to strengthen their research credibility/visibility.
 The
details of the workshop are as follows:

Title  :
   Introductory Workshop on Strategies to Enhance Research
Visibility, Impact & Citations
Date :   
3 April 2015 (Friday)
Time :  9.30
am – 11.30 am
Venue  : Computer
Room, Level 2, IPPP.
Speaker : Dr.
Nader Ale Ebrahim    

Admission is free
Seats
are limited.  For registration please call 03-79676289 or email us
your name, position, faculty, phone number and email address to
pengarah_ppp_ippp@um.edu.my by
2 April 2015.
For
details of workshop, please refer to attachment or contact Mdm Tuty Haryati
Kassim (ext 6942/
tutyharyati@um.edu.my).
*
as at 31 December 2015


Research Tools By: Nader Ale Ebrahim - MindMeister Mind Map

Sunday, 29 March 2015

Mind Maps®: Learning Skills from MindTools.com

Source: http://www.mindtools.com/pages/article/newISS_01.htm

Mind Maps®

A Powerful Approach to Note-Taking 

(Also known as Mind Mapping, Concept Mapping, Spray Diagrams, and Spider Diagrams)

"Mind Map" is a trademark of the Buzan Organization (see www.buzan.com). We have no association with this organization.
Record ideas memorably

with James Manktelow & Amy Carlson.


Have you ever studied a subject or brainstormed an idea, only to find
yourself with pages of information, but no clear view of how it fits
together?


This is where Mind Mapping can help you.


Mind Mapping is a useful technique that helps you learn more
effectively, improves the way that you record information, and supports
and enhances creative problem solving.


By using Mind Maps, you can quickly identify and understand the
structure of a subject. You can see the way that pieces of information
fit together, as well as recording the raw facts contained in normal
notes.


More than this, Mind Maps help you remember information, as they hold
it in a format that your mind finds easy to recall and quick to review.


About Mind Maps

Mind Maps were popularized by author and consultant, Tony Buzan. They
use a two-dimensional structure, instead of the list format
conventionally used to take notes.


Mind Maps are more compact than conventional notes, often taking up
one side of paper. This helps you to make associations easily, and generate new ideas  . If you find out more information after you have drawn a Mind Map, then you can easily integrate it with little disruption.


More than this, Mind Mapping helps you break large projects or topics
down into manageable chunks, so that you can plan effectively without
getting overwhelmed and without forgetting something important.


A good Mind Map shows the "shape" of the subject, the relative
importance of individual points, and the way in which facts relate to
one another. This means that they're very quick to review, as you can
often refresh information in your mind just by glancing at one. In this
way, they can be effective mnemonics – remembering the shape and
structure of a Mind Map can give you the cues you need to remember the
information within it.


When created using colors and images or drawings, a Mind Map can even resemble a work of art!


Uses

Mind Maps are useful for:


  • Brainstorming   – individually, and as a group.
  • Summarizing information, and note taking.
  • Consolidating information from different research sources.
  • Thinking through complex problems.
  • Presenting information in a format that shows the overall structure of your subject.
  • Studying and memorizing information.

Drawing Basic Mind Maps

To draw a Mind Map, follow these steps:


1. Write the title of the subject you're exploring in the center of
the page, and draw a circle around it. This is shown by the circle
marked in figure 1, below.


(Our simple example shows someone brainstorming actions needed to deliver a successful presentation.)


Figure 1

Example Mind Map: Step 1
2. As you come across major subdivisions or subheadings of the topic
(or important facts that relate to the subject) draw lines out from this
circle. Label these lines with these subdivisions or subheadings. (See
figure 2, below.)


Figure 2

Example Mind Map: Step 2
3. As you "burrow" into the subject and uncover another level of
information (further subheadings, or individual facts) belonging to the
subheadings, draw these as lines linked to the subheading lines. These
are shown in figure 3.


Figure 3

Example Mind Map: Step 3
4. Then, for individual facts or ideas, draw lines out from the
appropriate heading line and label them. These are shown in Figure 4.


Figure 4

Example Mind Map: Step 4
5. As you come across new information, link it in to the Mind Map appropriately.


A complete Mind Map may have main topic lines radiating in all
directions from the center. Sub-topics and facts will branch off these,
like branches and twigs from the trunk of a tree. You don't need to
worry about the structure you produce, as this will evolve of its own
accord.


Tip:

While drawing Mind Maps by hand is appropriate in many cases, software tools and apps like Coggle, Bubbl.usMindmeisterMindGenius, iMindMap, and Mindjet can improve the process by helping you to produce high quality Mind Maps, which you can then easily edit or redraft. (Click here for a full list of Mind Map software.)


Using Mind Maps Effectively

Once you understand how to take notes in Mind Map format, you can
develop your own conventions for taking them further. The following
suggestions can help you draw impactful Mind Maps:


  • Use Single Words or Simple Phrases – Many words in
    normal writing are padding, as they ensure that facts are conveyed in
    the correct context, and in a format that is pleasant to read.


    In Mind Maps, single strong words and short, meaningful phrases can
    convey the same meaning more potently. Excess words just clutter the
    Mind Map.


  • Print Words – Joined up or indistinct writing is more difficult to read.
  • Use Color to Separate Different Ideas – This will
    help you to separate ideas where necessary. It also helps you to
    visualize the Mind Map for recall. Color can help to show the
    organization of the subject.
  • Use Symbols and Images – Pictures can help you to
    remember information more effectively than words, so, where a symbol or
    picture means something to you, use it. (You can use photo libraries
    like iStockPhoto to source images inexpensively.)
  • Using Cross-Linkages – Information in one part of a
    Mind Map may relate to another part. Here you can draw lines to show
    the cross-linkages. This helps you to see how one part of the subject
    affects another.

Visual Example

Click on the thumbnail below for a great example of a Mind Map that has high visual impact:


Example Mind Map

Key Points

Mind Mapping is an extremely effective method of taking notes. Not
only do Mind Maps show facts, they also show the overall structure of a
subject and the relative importance of individual parts of it. They help
you to associate ideas, think creatively, and make connections that you
might not otherwise make.


Mind Maps are useful for summarizing information, for consolidating
large chunks of information, for making connections, and for creative
problem solving.


To use Mind Maps effectively, make sure you print your words, use
different colors to add visual impact, and incorporate symbols and
images to further spur creative thinking.


If you do any form of research or note taking, try experimenting with Mind Maps. You'll love using them!


This site teaches you the skills you need for a happy and successful
career; and this is just one of many tools and resources that you'll
find here at Mind Tools. Subscribe to our free newsletter, or join the Mind Tools Club and really supercharge your career!


Add this article to My Learning Plan


Mind Maps®: Learning Skills from MindTools.com

Information Visualization: Word Clouds, Phrase Nets, Tree Maps | Virtual Tool Cupboard | e-lab

 Source: http://tools.elab.athabascau.ca/tutorials/information-visualization-word-clouds-phrase-nets-tree-maps

Information Visualization: Word Clouds, Phrase Nets, Tree Maps

Digital Creation: Information Visualization: Word Clouds, Phrase Nets, Tree Maps

A
visualization is a way of quickly and clearly expressing complex
information. Information visualizations are constantly being used and
created – a hurried sketch, a scribbled map, the pictorial instructions
provided to help assemble furniture – are all examples of everyday
practices of information visualization. We are used to seeing and
interpreting bar charts and pie charts in presentations, reports, and
even on sign boards. Most of us have used a pen and napkin to draw out
ideas for someone else to understand; digital tools can extend this
common presentational practice to various forms of data. There are
numerous tools designed to help you make charts and graphs, some of
which can be found within your word processing software. However, there
are many other open source tools which can be found online and used for
free. Beyond professionalizing your portfolio, learning how to create
visualizations will give you another way of experimenting with and
articulating arguments about data.

Visualization of data does
not necessarily have to involve numbers. Data can be represented in many
other forms. Word Lists can segment documents into long word strings;
Word Clouds and Tree Maps can create graphic ways of seeing data; and
Word Trees and Phrase Nets can point to connections between word
strings. Compelling experiments are also being done using language
analysis in structuring artistic representations of text.

Beginning Your Work

A good place to begin creating visualizations is with a simple ‘cut and paste’ resource such as a Word Cloud tool like Wordle.
This site gives you three ways to input data and rapidly produces an
image you can save as a screen shot or save to the site. Secondary
research can begin resource hubs like IBM’s Many Eyes.
Although you will need to create a user account and log into the site,
Many Eyes brings together and hosts a large collection of visualization
software and takes users through the basics of preparing their data.

One
of the main things to remember when it comes to creating and using
visualizations is that they present a different way of reading. In order
to present data, software programs chop text up into its component
parts. In order to make most effective use of the software, you will
need to organize and normalize your research data, and you will need to
know how to “read” the visualization.

The program will need to
normalize your data in order to be able to classify the text and create
the visualizations. Most frequently this means stripping some of the
formatting from the text which is applied as part of a word processing
tool. There are a number of ways of doing this, through your browser, in
your word processor, and in note pad widget. For more advanced
visualizations you may also need to preprocess your data by getting it
into a spread sheet so the program can read it.

In many
visualizations, size is equated with frequency: the physical size of a
word  in the cloud accords with the frequency of its appearance in the
text being analyzed. For the most part, these tools will remove some of
the most frequently-used “stop words” such as “and” and “the,” making it
easier to see the remaining “hot words.” This makes it easier for the
researcher to identify some of the more interesting words in the text.
However, because cloud tools remove form and context, the quick picture
they develop may represent an accurate pictorial concordance, but it
does not retell a text. Analysis begins with the scholar’s
interpretation of what is present and what is absent. Alternatively,
concept maps and phrase nets preserve some context, enabling scholars to
“read” across visualizations; but these types of visualization also
remove phrases from the large framework. So, as with the cloud tools,
maps and phrase nets enable discovery, but the scholar must be careful
to support any assertions about the text based on visualization alone.

Secondary Uses

One
of the off-label prescriptions for these tools is also one of the most
useful. These resources can  be employed to analyze your own writing.
Phrase nets and Word Trees can be used to look for over-used phrases.
Word clouds are excellent ways of detecting repetition across documents
that you have authored, which is helpful, since repetition is not easy
to recognize in your own work.


Web Tool Visualizations
Word Clouds

Visualization Tools Hub


Current Projects


Writing Without Words


Additional Reading

Philippe Gambette and Jean
Veronis. “Visualizing a Text with a Tree Cloud.” IFCS'09: International
Federation of Classification Societies Conference. (2009)

Romain
Vuillemot, Tanya Clement, Catherine Plaisant, Amit Kumar. “What’s Being
Said Near “Martha”?: Exploring Name Entities in Literary Text
Collections”


Martin Wattenberg and Fernanda B. Viégas “The Word Tree, an
Interactive Visual Concordance” IEEE Transaction on Visulaization and
Computer Graphics.14: 6. (2008)


Frank van Ham, Martin Wattenberg, Fernanda B. Viégas. Mapping Text with Phrase Nets.. IEEE InfoVis 2009.


Christopher Burke. Isotype: Representing social facts pictorially: Information Design Journal (IDJ) 17:3. (2009)


Related Tools: 
Tutorial Categories: 


Information Visualization: Word Clouds, Phrase Nets, Tree Maps | Virtual Tool Cupboard | e-lab

Saturday, 28 March 2015

Merging EndNote Libraries

 Source: http://ask.unimelb.edu.au/app/answers/detail/a_id/3831/~/merging-endnote-libraries


Merging EndNote Libraries

How do I merge multiple EndNote libraries?

There are two ways to merge EndNote libraries:


  • Copy, or drag & drop references from one library to another

  • Import one library into another.
Important: any time you add
references to a library, the newly added references are assigned new
record numbers in the order that they are added to the library, which
affects their use in documents (e.g. a reference that was Reference
Number #23 in a smaller library could become Reference Number #600 in a
larger library). As a result, if a merged library is used to format Word
documents that has citations inserted from the previous library,
EndNote may request that you select matching references from your
library for citations in the document.


Copy, or drag & drop references from one library to another

To use this option, open all relevant EndNote libraries.


Copying & pasting method


  • Select the references that you want to copy and choose Copy from the Edit menu.

  • Click into the new library location and choose Paste from the Edit menu.

Using Drag & Drop

To copy specific references from one library to another, simply
select them in one library (hold down the CTRL key to select
non-consecutive references; use the SHIFT key to select a range), click
on any part of the selection and use the mouse to drag the selection to
another library.  The selected references are copied to the library
where they were "dropped."


Importing EndNote Libraries


  • To import one EndNote library into another, use the Import command from the File menu.

  • Choose the EndNote Library import option and be sure to pick the appropriate "Duplicates" setting.

  • The advantage of using the Import command over the other two
    methods mentioned above is it provides the ability to filter out
    duplicate references.
If you require further support on this topic please contact the EndNote support staff via our online form.


ask.unimelb : Merging EndNote Libraries

Merging EndNote libraries

 Source: http://covendnote.blogspot.com/2007/05/merging-endnote-libraries.html


Merging EndNote libraries

It is possible to merge
two separate EndNote libraries into one single library. You can do this
with two libraries created in EndNote X, or merge a library created in
an older version of the EndNote software with your new EndNote X
library.

  • Open the EndNote Library that you want to put all your references into.
  • Click on File > Import.
  • Click on the Choose File button and find the Library that you want to import. Click on OK.
  • Under Import Options choose EndNote Library from the list.
  • Under Duplicates choose whether you want to import all the references, or whether you want EndNote to check for and discard any duplicates.
  • Under Text Translation choose No translation from the list.
  • Click on Import.
Once the references have copied across, click on References > Show all references to view your complete Library.


CovEndNote: Merging EndNote libraries

Equality of Google Scholar with Web of Science Citations

Equality of Google Scholar with Web of Science Citations: Case of Malaysian Engineering Highly Cited Papers

Nader Ale Ebrahim, Hadi Salehi, Mohamed Amin
Embi, Mahmoud Danaee, Marjan Mohammadjafari, Azam Zavvari, Masoud
Shakiba, Masoomeh Shahbazi-Moghadam


Abstract


This study uses citation analysis from two citation tracking
databases, Google Scholar (GS) and ISI Web of Science, in order to test
the correlation between them and examine the effect of the number of
paper versions on citations. The data were retrieved from the Essential
Science Indicators and Google Scholar for 101 highly cited papers from
Malaysia in the field of engineering. An equation for estimating the
citation in ISI based on Google scholar is offered. The results show a
significant and positive relationship between both citation in Google
Scholar and ISI Web of Science with the number of versions. This
relationship is higher between versions and ISI citations (r = 0.395,
p<0.01) than between versions and Google Scholar citations (r =
0.315, p<0.01). Free access to data provided by Google Scholar and
the correlation to get ISI citation which is costly, allow more
transparency in tenure reviews, funding agency and other science policy,
to count citations and analyze scholars’ performance more precisely.

Full Text:
PDF
DOI: 10.5539/mas.v8n5p63


Creative Commons License


This work is licensed under a Creative Commons Attribution 3.0 License.


Modern Applied Science   ISSN 1913-1844 (Print)   ISSN 1913-1852 (Online)


Equality of Google Scholar with Web of Science Citations: Case of Malaysian Engineering Highly Cited Papers | Ebrahim | Modern Applied Science

Friday, 27 March 2015

Contribution of information and communication technology (ICT) in country'S H-index


Contribution of information and communication technology (ICT) in country'S H-index

Farhadi, M.; Salehi, H.; Embi, M.A.; Fooladi, M.; Farhadi, H.; Aehaei Chadegani, A.; Ale Ebrahim, N. (2013) Contribution of information and communication technology (ICT) in country'S H-index. Journal of Theoretical and Applied Information Technology, 57 (1). pp. 122-127. ISSN 1992-8645
[img] PDF - Published Version [error in script]
Download (140Kb) | Preview

Abstract

The
aim of this study is to examine the effect of Information and
Communication Technology (ICT) development on country's scientific
ranking as measured by H-index. Moreover, this study applies ICT
development sub-indices including ICT Use, ICT Access and ICT skill to
find the distinct effect of these sub-indices on country's H-index. To
this purpose, required data for the panel of 14 Middle East countries
over the period 1995 to 2009 is collected. Findings of the current study
show that ICT development increases the H-index of the sample
countries. The results also indicate that ICT Use and ICT Skill
sub-indices positively contribute to higher H-index but the effect of
ICT access on country's H-index is not clear.
Item Type: Article
Creators:
  1. Farhadi, M.
  2. Salehi, H.
  3. Embi, M.A.
  4. Fooladi, M.
  5. Farhadi, H.
  6. Aehaei Chadegani, A.
  7. Ale Ebrahim, N.
Journal or Publication Title: Journal of Theoretical and Applied Information Technology
Uncontrolled Keywords: Information and Communication Technology (ICT) development, H-index, Middle East
Subjects: A General Works
H Social Sciences > H Social Sciences (General)
H Social Sciences > HB Economic Theory
L Education > L Education (General)
T Technology > T Technology (General)
Divisions: Faculty of Engineering
Depositing User: Dr. Nader Ale Ebrahim
Date Deposited: 17 Dec 2014 09:03
Last Modified: 17 Dec 2014 09:03
URI: http://eprints.um.edu.my/id/eprint/8547

Actions (For repository staff only: Login required)

UM Research Repository

Content Overview | Scopus

Source: http://www.elsevier.com/online-tools/scopus/content-overview


Content Overview

Scopus Header Image


Contact Support get_quote_button login_to_scopus blog_scopus_button

The largest up-to-date collection of global, unbiased and expertly sourced research

You
need to keep track of what's happening in your research world. Across
all research fields—science, mathematics, engineering, technology,
health and medicine, social sciences, and arts and humanities—Scopus
delivers a broad overview of global, interdisciplinary scientific
information
that researchers like you need.

Comprehensive:
You never know where your research enquiries will take you. It's why
Scopus has twice as many titles and over 30% more publishers listed than
any other A&I database, with interdisciplinary content that covers
the research spectrum: timely updates from thousands of
peer-reviewed journals; preliminary findings from millions of
conference papers; and the thorough analysis in thousands of books.
Frequently updated: Never miss out on what's new in your field. Scopus is the only leading database that is updated daily rather than just weekly.
Unbiased:
You can rely on our independent and expert content selection &
advisory board (CSAB) using strict criteria to vet every source that
Scopus includes. Learn more
about our current board and content selection methods.
Reliable:
By focusing on the world of research, you can trust that your Scopus
search results will be accurate and relevant, and delivered to you
quickly so you can spend less time searching and more time reading.scopus infograph
  • Life Sciences (agriculture, biology, neuroscience, pharmacology)
  • Social Sciences (arts & humanities, business, history, information sciences)
  • Physical Sciences (chemistry, engineering, mathematics)
  • Health Sciences (allied health, dentistry, nursing, veterinary medicine)
What content is included in Scopus?

  • Journals: Over 21,000 titles from more than 5,000 international publishers (see the journal title list)
    • More than 20,000 peer-reviewed journals, including 2,800 gold open access journals
    • Over 365 trade publications
    • Articles-in-press
      (i.e., articles that have been accepted for publication) from more than
      3,750 journals and publishers, including Cambridge University Press,
      the Institute of Electrical and Electronics Engineers (IEEE), Nature
      Publishing Group, Springer, Wiley-Blackwell and, of course, Elsevier
  • Conference papers: 6.5 million conference papers from over 17,000 worldwide events
    • High energy physics from the inSPIRE database
    • Computer science conferences and workshops from DBLP Computer Science Bibliography
    • Society
      meetings including the IEEE, American Chemical Society (ACS),
      Association for Computing Machinery (ACM), Society of Petroleum
      Engineers (SPE), The Minerals, Metals & Materials Society (TMS),
      American Geophysical Union (AGU), European Society of Cardiology (ESC),
      International Society for
      Chemotherapy (ISC), American Society for Information Security
      (ASIS), Japan Society of Mechanical Engineers (JSME), and many more
  • Patents: 24 million patents from five patent offices
    • US Patent & Trademark Office
    • European Patent Office
    • Japan Patent Office
    • World Intellectual Property Organization
    • UK Intellectual Property Office
Scopus journal title list - February 2015
Scopus Content Coverage Guide

Scopus Content Fact Sheet


Scopus Book Title List
- February 2015


Content Overview | Elsevier

Free Introductory Workshop on Strategies to Enhance Research Visibility, Impact & Citations


Title  :    Introductory Workshop on Strategies to
Enhance Research Visibility, Impact & Citations
Date :    3 April 2015 (Friday)
Time :  9.30
am – 11.30 am
Venue  : Computer
Room, Level 2, IPPP.
Speaker : Dr.
Nader Ale Ebrahim    

Admission is
free
Seats
are limited.  For registration please call 03-79676289 or email us
your name, position, faculty, phone number and email address to
pengarah_ppp_ippp@um.edu.my by 2 April 2015.
For
details of workshop, please refer to attachment or contact Mdm Tuty Haryati
Kassim (ext 6942/
tutyharyati@um.edu.my).
* as at 31 December 2015


Free Introductory Workshop on Strategies to Enhance Research Visibility, Impact & Citations

Research output of science, technology and bioscience publications in Asia

 Source: http://www.escienceediting.org/journal/view.php?number=16

Science Editing > Volume 1(2); 2014 > Article


Abstract

Publication growth rates in Asia
have been rapidly increasing since 2000. Amid this constant rise in the
quantity of papers, however, concerns over the quality of research
output in Asia have also increased. The purpose of this paper is to
examine science and technology journals in Asia where research is
burgeoning and to find ways to enhance the visibility and frequency of citation
of articles published by non-Organization for Economic Cooperation and
Development and developing countries in Asia. In this work, the research
output of twelve countries in science and engineering over the last
five years is studied, using the Scopus database. We compared
publication growth, number of citations per publication, the
field-weighted citation impact of publications, national and
international collaboration rates, and the number of journals in each
country found in the Scopus database. We find that a predominant number
of research papers produced in developing Asian countries are in
technology. Hence, most research papers produced in Asian regions appear
to have lower citation rates and are often devaluated. We suggest this
devaluation relates to an individual state’s strategy for national
development, or policy priorities for choosing whether to invest
primarily in basic science or applied science. Further, this work
suggests that enhancing the accessibility and visibility of local
academic journals can be conducive to enhancing the quality of research
output, both in developing countries and in the world overall.
Go to : Goto

Introduction

Among 1,685,703 total academic papers published on science, technology and bioscience in 2013 [1],
33.4% were produced in the European Union, 20.7% in the United States,
and 38.3% were from the largest countries in Asia (the sum of China,
India, Japan, Korea, and Taiwan). Publication growth rates in Asia have
been rapidly increasing since 2000, particularly in China. China has now
become the world’s second largest country in terms of size of research
publication: the country has published more research work than the
United Kingdom, and is projected to surpass the United States as the
largest academic producer by 2020. Other emerging academies in countries
such as Brazil, India, and South Korea are also expected to surpass
France and Japan in terms of research output in the next six years [2].
Amid this constant rise in the quantity of papers,
however, concerns over the quality of research output in Asia have also
increased. In Asia, technology appears to be a more important field than
science, given an emphasis in many countries on practical subjects. The
purpose of this paper is to examine science and technology journals in
Asia where research is burgeoning, and to find ways to enhance the
visibility and frequency of citation of articles published by
non-Organization for Economic Cooperation and Development (OECD) and
developing countries in Asia.
Go to : Goto

Methods

This work analyzed the research output of twelve
countries in science (physics, chemistry, mathematics, and earth and
planetary sciences), technology (engineering, computer science, chemical
engineering, energy, and materials science), and bioscience
(biochemistry, genetics, agricultural and biological sciences, and
neuroscience). The outputs of China, India, Indonesia, Japan, Korea,
Malaysia, Mongolia, the Philippines, Singapore, Taiwan, Thailand, and
Vietnam over the last five years (2009 to 2013) were compared using the
Scopus database. We compared publication growth, number of citations per
publication (CPP), national and international collaboration rates, and
the number of journals from each country in the Scopus and SciVal
databases.
Go to : Goto

Results

Science research performance

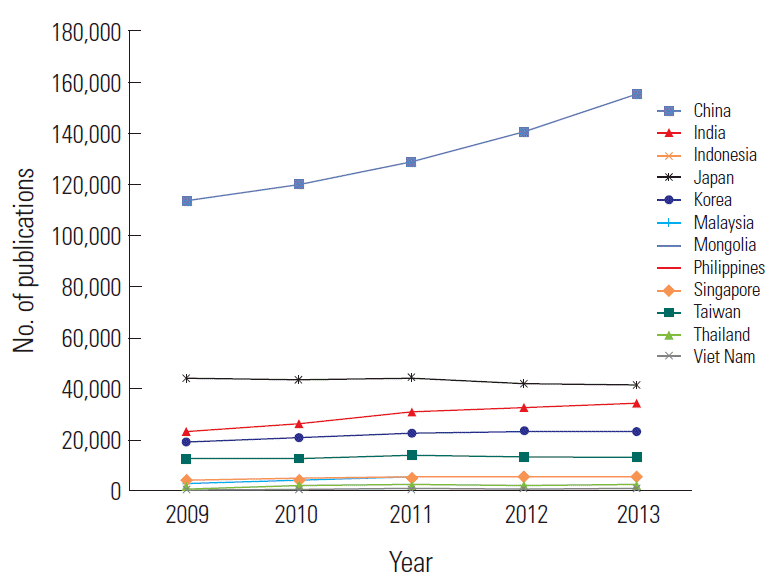
Approximately 90% of sciences papers in Asia come
from four countries: China, Japan, India, and Korea. Since 2010, China
and India have shown rapid publication growth rates (Fig. 1).
Excepting Japan, research output has increased in all other Asian
countries. In Japan, research output in the sciences has grown only in
earth science. The share of Chinese articles in science has grown at a
compound annual growth rate of 8.14% from 2009 to 2013. When compared to
other subjects, publications in mathematics in China have grown slowly.
However, output of articles from Indonesia, Malaysia, and Vietnam’s
output have nearly doubled.

/upload/thumbnails/se-1-2-62f1.gif

Fig. 1.

Number of publications by science field of Asian countries from 2009 to 2013.
Download Figure
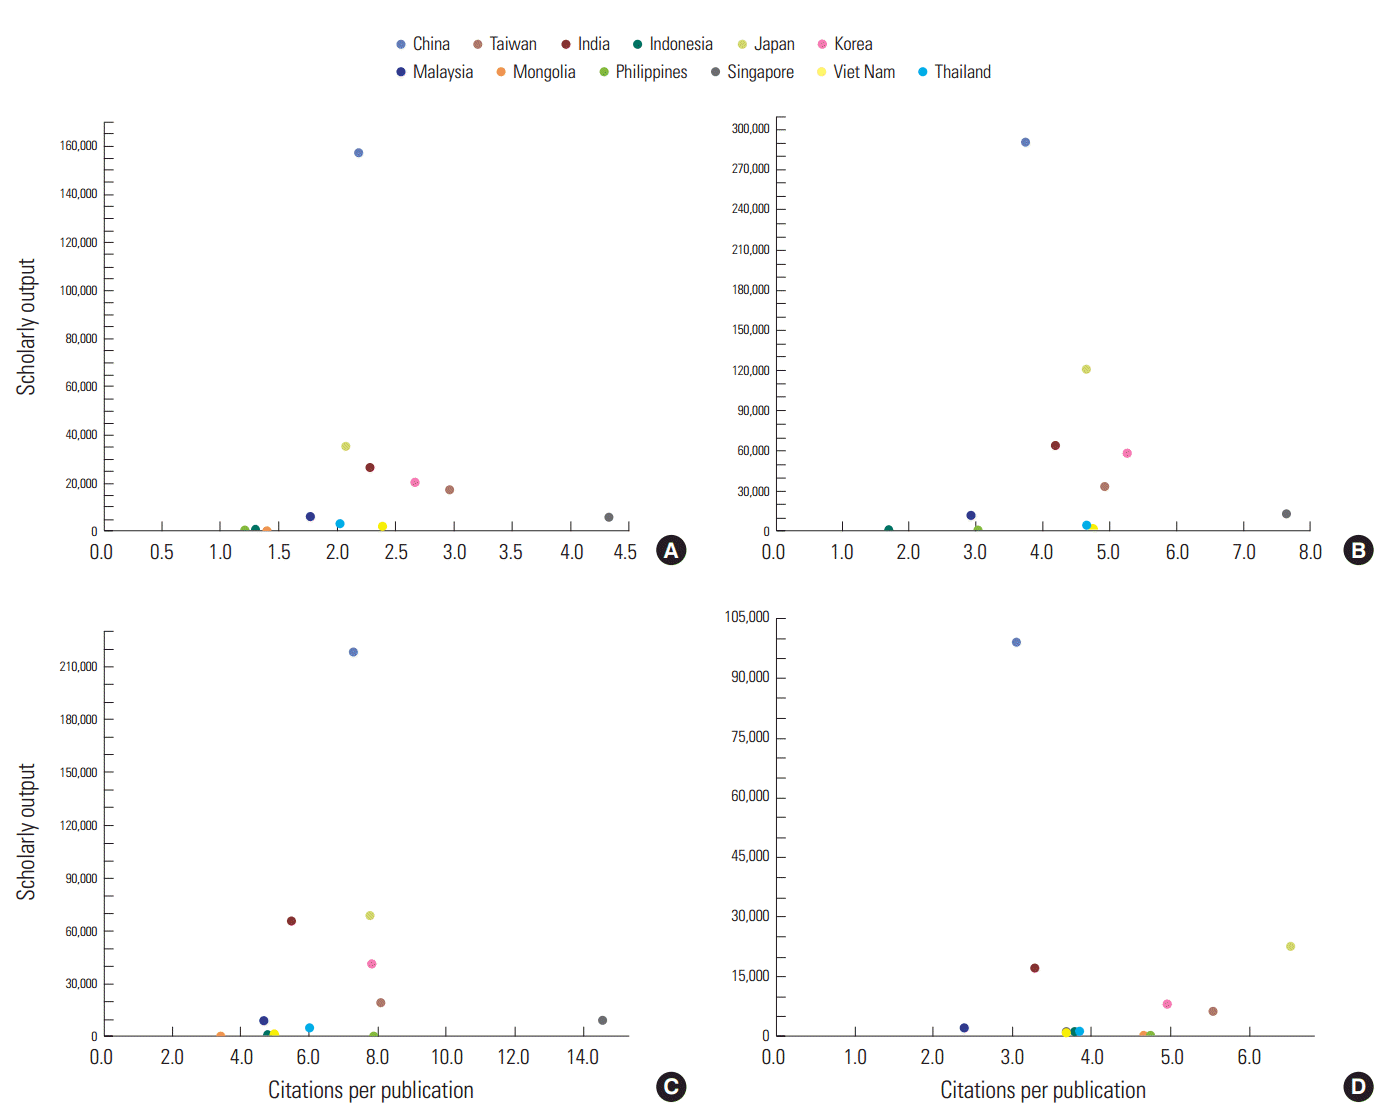
On citation value, Singapore leads Asian countries.
While citation of Chinese papers is generally low, however, CPP are
gradually increasing, which may suggest the quality of Chinese
publications is increasing (Fig. 2).
In mathematics, physics, chemistry, and biochemistry, Singapore has the
highest CPP, suggesting high quality papers, while Vietnam and Japan
show high CPP rates in mathematics and earth and planetary science,
respectively.

/upload/thumbnails/se-1-2-62f2.gif

Fig. 2.

Number of
publications and citations per publication, by Asian country in sciences
fields, from 2009 to 2013: (A) mathematics, (B) physics, (C) chemistry,
and (D) earth and planetary science.
Download Figure
Mongolia is the most collaborative of the twelve countries studied (Fig. 3).
Excepting China, the collaboration rates in all other countries are
above average (world average rate, 23.1%). Japan has shown a marginal
increase in international collaboration over the past five years. Both
the relatively high level and growth of international collaboration in
Singapore may be one of key factors contributing to their increasing
citation impact.

/upload/thumbnails/se-1-2-62f3.gif

Fig. 3.

International collaboration rate of Asian country by science field.
Download Figure

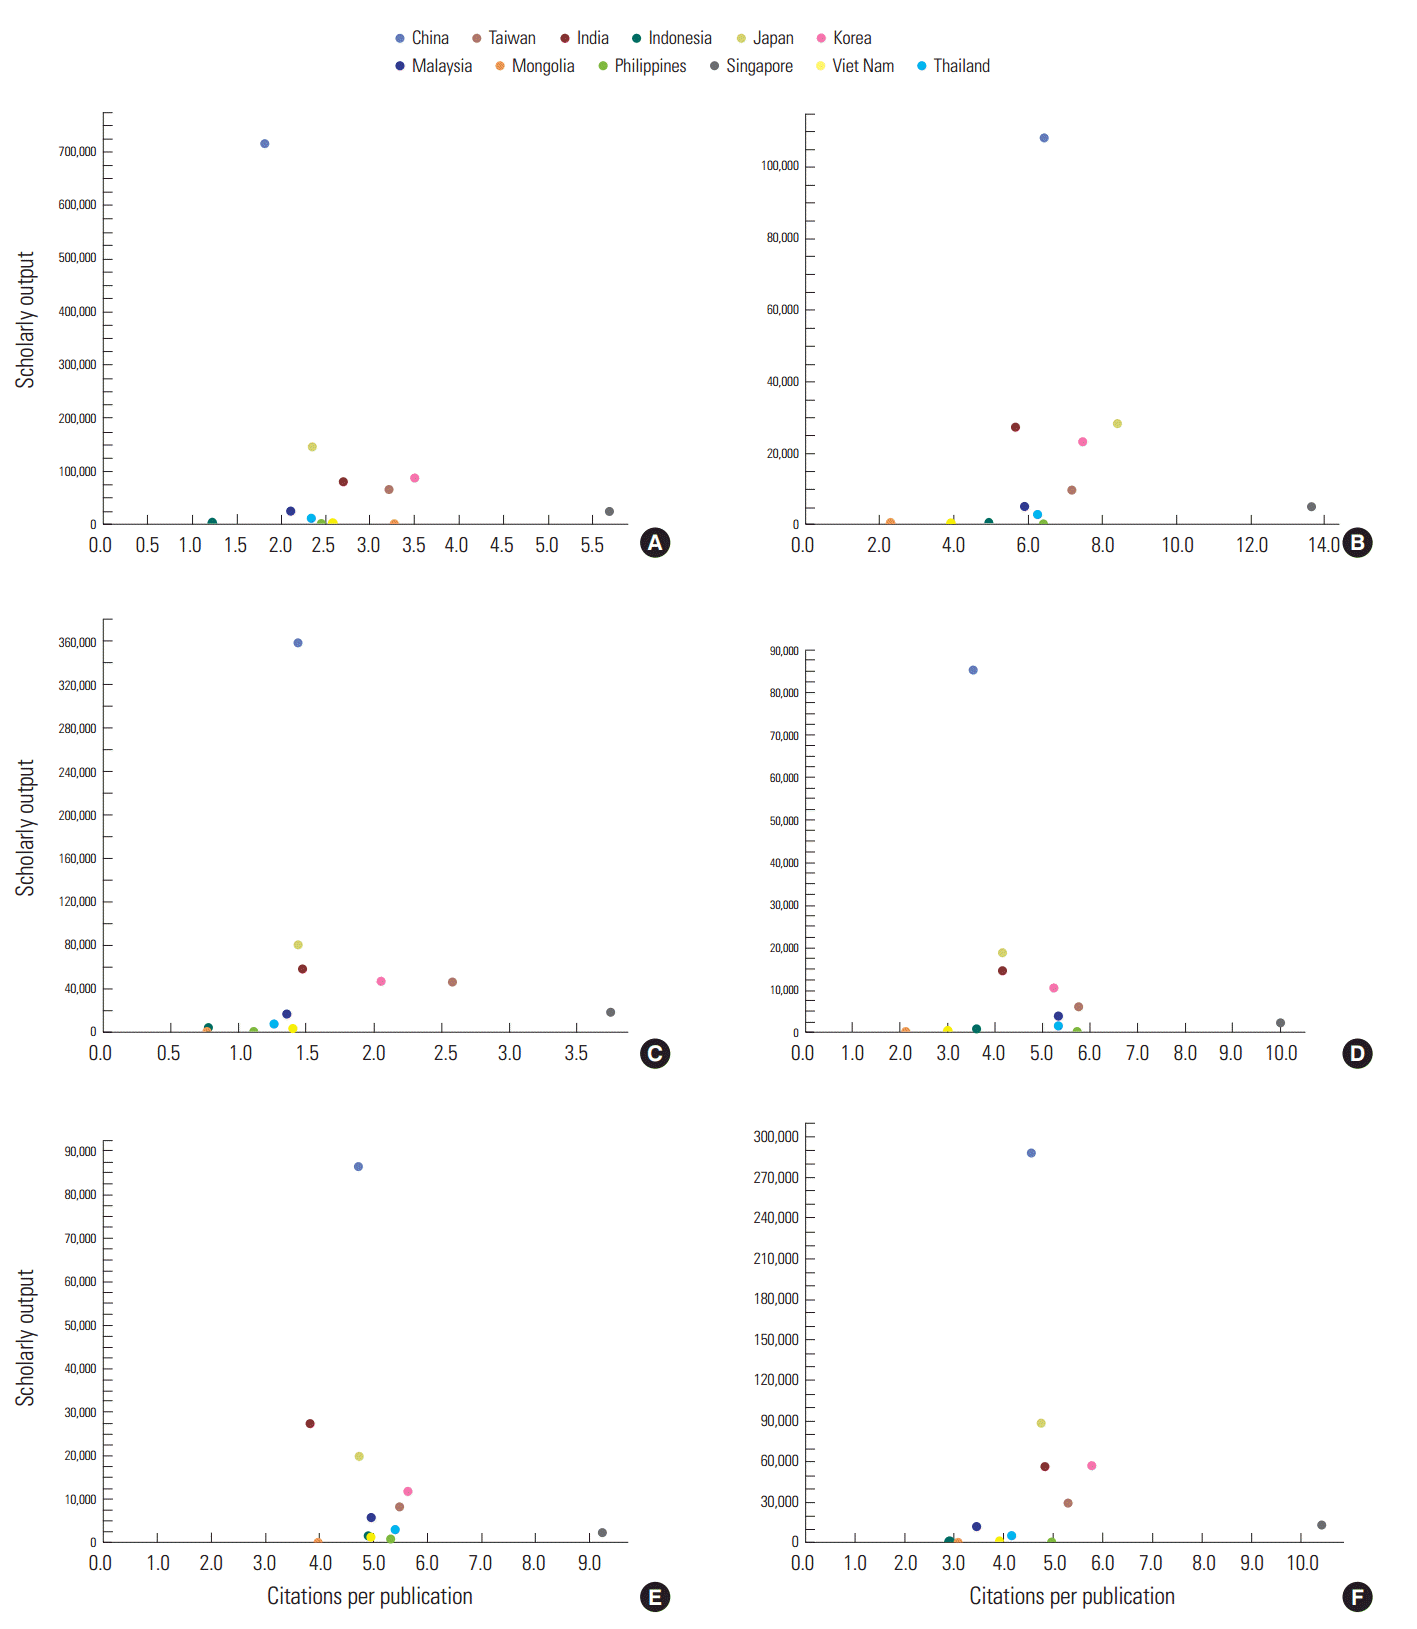
Technology research performance

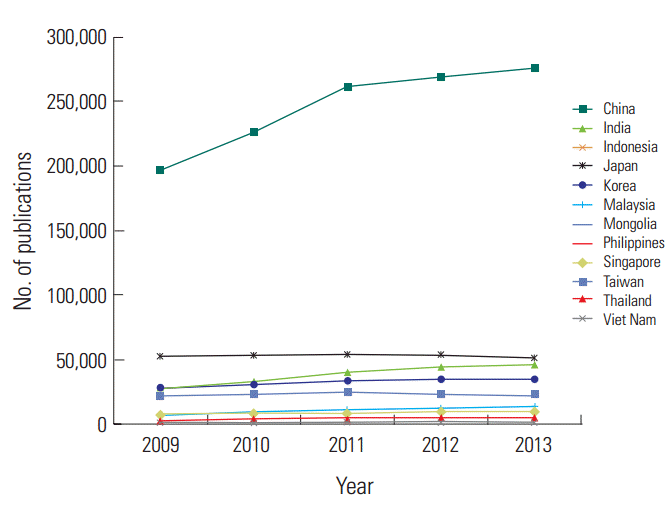
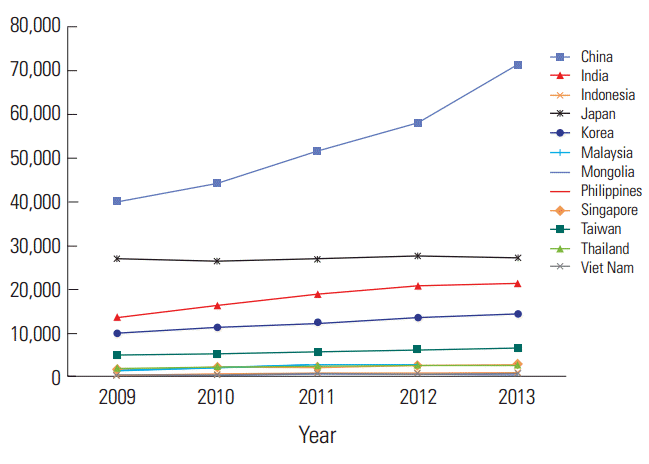
Research output among the five relatively large Asian
economies—China, Japan, Korea, India, and Taiwan—occupies 93% of total
publications in technology (Fig. 4).
In China, Japan, Korea, Taiwan, and Singapore, the growth rate of
research output in technology was higher than that of science. Computer
science research output in China has declined by 25.2% since 2010. Japan
experienced declines in all sectors—including 11% in engineering and
materials—save a 6.6% increase in environmental sciences (Fig. 5).
India experienced sharp output increases in computer science (75.7%)
and chemical engineering (63.7%) during the study period. In Asia, the
CPP rate in technology was lower than the CPP rate in science overall,
except in Malaysia. As in science, Singapore’s CPP rate in technology is
remarkably higher than in other countries.

/upload/thumbnails/se-1-2-62f4.gif

Fig. 4.

Number of publications by technology field in Asian countries from 2009 to 2013.
Download Figure

/upload/thumbnails/se-1-2-62f5.gif

Fig. 5.

Number of
publications and citations per publication in Asian countries by
technology field from 2009 to 2013: (A) engineering, (B) chemical
engineering, (C) computer science, (D) energy, (E) environmental
science, and (F) materials (continued to the next page).
Download Figure
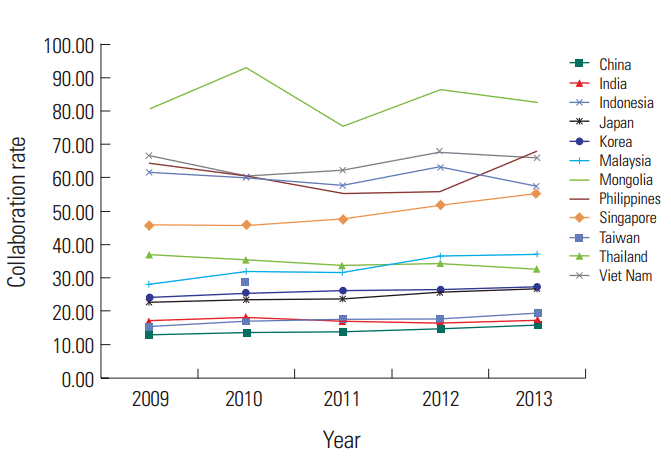
In technology, Mongolia is the most internationally collaborative country (Fig. 6).
Overall, collaboration figures are larger for smaller and less
scientifically active countries. China’s publication growth is the
fastest, however, but many researchers need time to become established
before they are in a position to seek collaborators. While India,
Taiwan, and China’s collaboration rates are under 20%, Korea and Japan’s
collaboration rates are 25.8% and 24.4%, respectively; these are
relatively low compared to European countries. These countries need to
boost their collaboration rates to increase research impact.

/upload/thumbnails/se-1-2-62f6.gif

Fig. 6.

International collaboration rate of each country by technology field.
Download Figure

Bioscience research performance

Among twelve countries, Malaysia shows the highest
output increase in bioscience, while both Vietnam and Indonesia have
increased bioscience output by over 100% (Fig. 7).
Bioscience articles in Japan, in contrast, increased by only 0.8%,
while science and technology output decreased. Overall, the rate of
publications has increased more in bioscience than in science and
technology.

/upload/thumbnails/se-1-2-62f7.gif

Fig. 7.

Number of publications by bioscience field for Asian countries from 2009 to 2013.
Download Figure
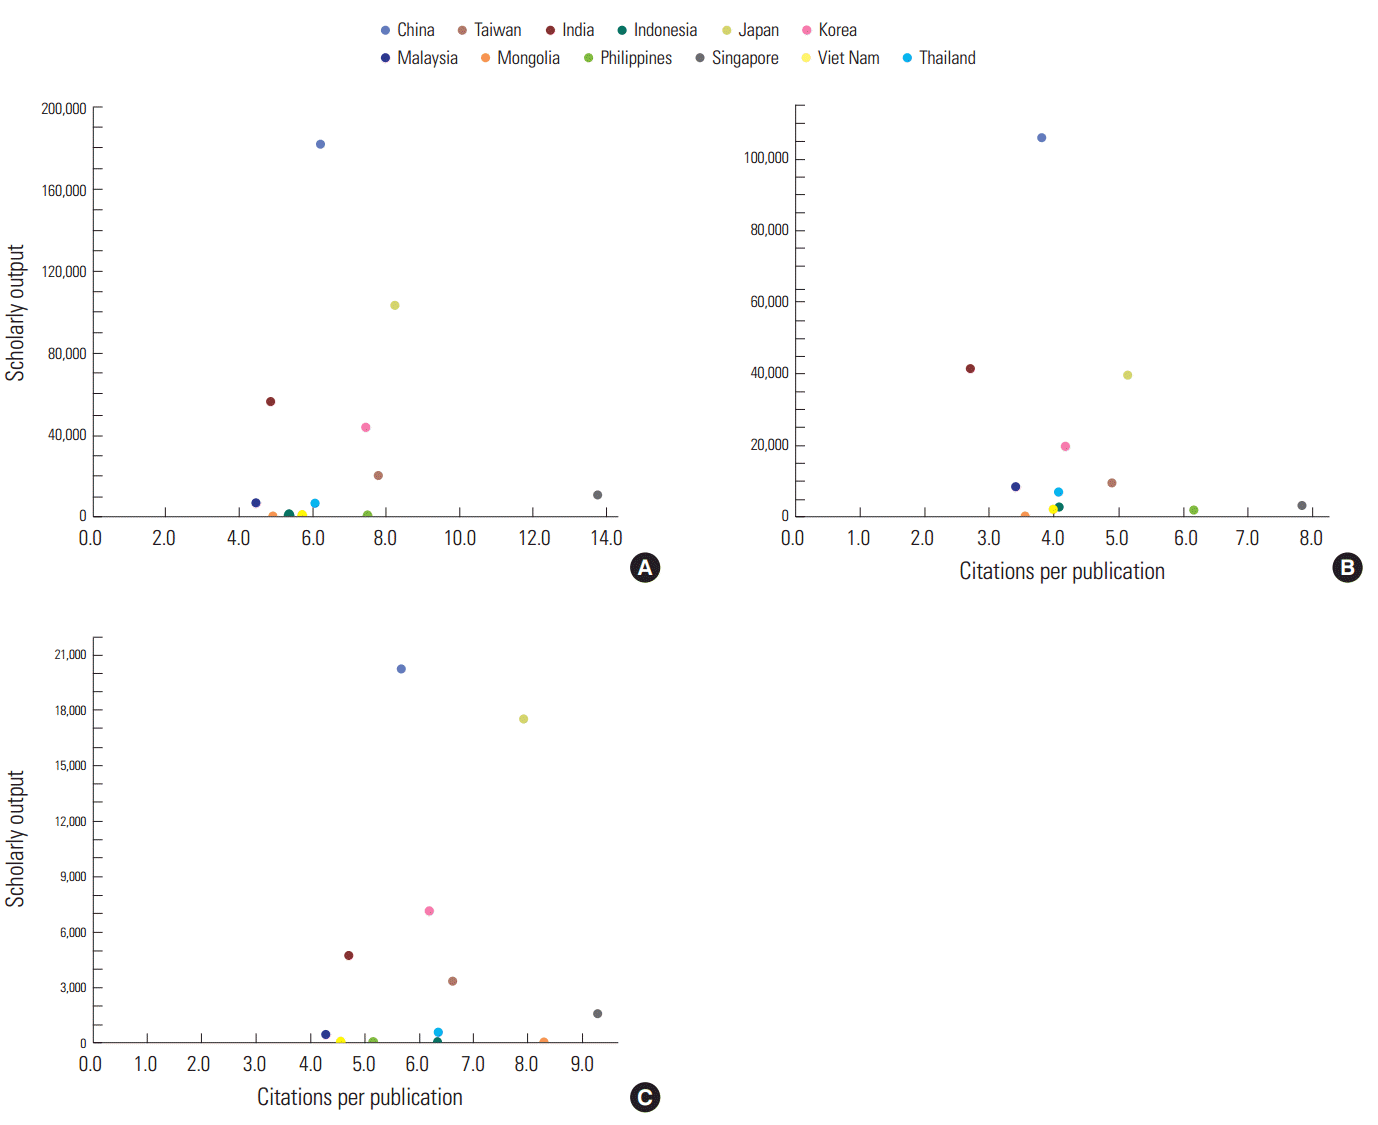
In addition to Bioscience research output, it is important to measure of quality of publications. As verified data (Table 1),
Citation and its CPP in Biochemistry and NuroScience in Citation is
very higher than other subjects. However, 11 countries’ CPP in
‘Biochemistry, Genetics and Molecular Biology’ and ‘Nuroscience’ except
Singapore is lower than world average CPP of 8.7 and 8.4 respectively. (Fig. 8) It is noticeable that Philippine is strong at its CPP in Agricultural and Biological Sciences as compared to 11 countries.

/upload/thumbnails/se-1-2-62f8.gif

Fig. 8.

Number of
publications and citations per publication in Asian countries by
bioscience field from 2009 to 2013: (A) biochemistry, genetics, and
molecular biology; (B) agricultural and biological sciences; and (C)
neuroscience.
Download Figure

Table 1.

Comparison of CPP rates, by discipline, in Asia and the world overall


2011

Rank of CPP

Asia

World

Biochemistry, genetics, and molecular biology

8.0

9.1

1

Chemistry

8.0

8.1

3

Chemical engineering

7.9

7.6

4

Environmental

5.2

5.2

5

Materials

5.3

5.1

6

Agricultural and biological science

4.9

5.1

6

Earth

4.2

4.6

8

Physics

4.2

4.6

8

Engineering

2.3

2.6

11

Math

2.5

2.6

11

Computer

1.8

2.2

13

Energy

4.8

4.4

10

Neuroscience

7.2

8.7

2
CCP, citations per publication.
Download Table
India, Japan, Korea, and Taiwan’s collaboration rates
in bioscience are lower than in science, while world averages trend in
the opposite direction (Fig. 9).
Given China’s slowly increasing rate of international collaboration, it
seems likely that increased quality of output will follow. Indonesia,
Mongolia and Vietnam’ collaboration rate in bioscience are around 80%;
researchers in these countries may be selected by researchers in other
countries with stronger supports for research. Over the last ten years,
Singapore’s international collaboration rate has steadily increased,
while collaboration in bioscience in other countries is fluctuating.

/upload/thumbnails/se-1-2-62f9.gif

Fig. 9.

International collaboration rate for Asian countries by bioscience field.
Download Figure

Comparing science, technology, and bioscience

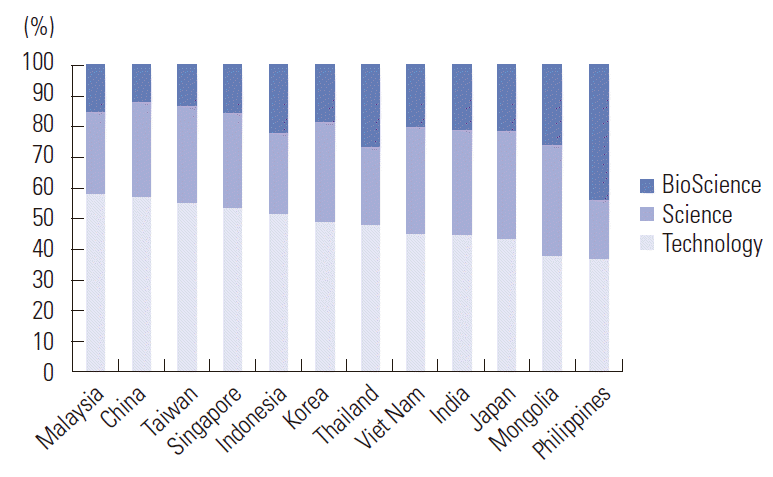
In most Asian countries, research output is predominantly in technology- rather than science-related disciplines (Fig. 10).
Forty eight percent of articles are assigned to technology, with
agricultural and biochemistry making up an average of 21.5% of these.
Overall, output ratios in agricultural and biology fields (agricultural
and biological sciences, biochemistry, genetics, and molecular biology)
are lower than average in all twelve countries. Individually, however,
India and Mongolia show strength in science while the Philippines shows
better performance in agriculture and biology. China shows a predominant
focus on technology rather than science, agricultural, and
biochemistry. Japan and India have more strength in science,
agriculture, and biology than in technology. Taiwan’s percentage of
agricultural and biology articles are lower than that of other countries
(average, 21.5%). The Philippines and Mongolia seem to focus more on
agriculture and biology than other countries.

/upload/thumbnails/se-1-2-62f10.gif

Fig. 10.

Comparison of research output in science, technology, and bioscience.
Download Figure
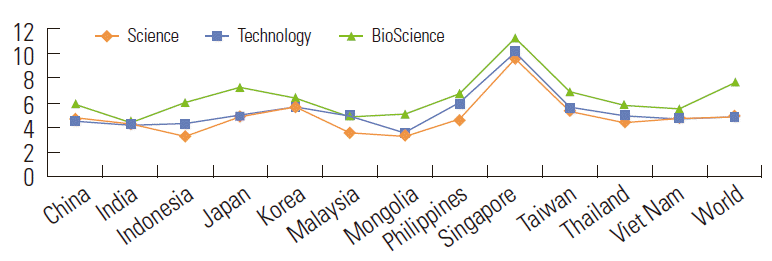
Average CPP in bioscience was higher than in science and technology (Fig. 11).
CPP in Singapore stands out among other countries. Japan’s CPP rate in
bioscience is higher only than Korea, but Korea has second highest CPP
rate overall. Only Malaysia’s CPP in technology was higher than its CPP
in science and bioscience. Given their publication rate, CPP rates in
the Philippines are strong. Overall, the bioscience CPP rate among these
twelve countries is relatively low compared to the world average
(7.67), while the technology CPP rate is higher than the world average
(4.88). Only Malaysia’s CPP in technology was higher than science and
bioscience. Philippine CPP is quite good as compared to its publication
quantities.

/upload/thumbnails/se-1-2-62f11.gif

Fig. 11.

Comparison of citations per publication in science, technology, and bioscience.
Download Figure
Go to : Goto

Discussion

China, Taiwan, Malaysia, and Singapore show a tendency to focus more on technology than on science and bioscience (Fig. 10).
In Japan, academic works focus more on science than technology; Japan’s
bioscience output rate is similar to the average rate for the twelve
countries. Korea’s output rate in both science and technology are higher
than that of bioscience. Meanwhile, scientific research in the
Philippines, Thailand, and Mongolia focus more on bioscience compared to
other countries. Amid the constant rise in the quantity of papers,
however, concerns over the quality of research output in Asia have also
been increasing (Figs. 1, 4, and 7).
To find ways to enhance the visibility and frequency of citation of
articles published by non-OECD and developing countries in Asia, we
consider both increasing collaboration to increase CPP, and improving
the visibility of articles by indexing journal titles on international
indexing databases.
In countries overall, the average CPP rate in
science-related disciplines (except mathematics) are higher than
technology-related disciplines (Table 1).
The same trend appears in Asia. A country’s average CPP generally
increases when publications in science-related, rather than
technology-related, disciplines increase. CPP is higher in biochemistry,
genetic and molecular biology, chemistry, and chemical engineering,
while notably lower in computer science, engineering, and mathematics
due to the characteristics of the subjects in those disciplines. Lower
CPP is generally understood to reflect lower quality of paper. In fact,
however, the number of average authors per paper, cited publication
ratio and journal count in several sectors such as engineering,
mathematics and computer science are smaller than those of other
disciplines like chemical engineering and chemistry. These factors lead
to relatively low citation: the number of authors per paper, 1.69 for
computer, 1.56 for mathematics, 1.75 for engineering, 2.12 for chemical
engineering, 1.89 for chemistry and 2.46 for biochemistry.International
collaboration strongly affects the citation rate of papers [2].
Including an international author brings a corresponding increase in
CPP rate or the impact of research. A project that includes two
countries gives twice as many citations, and increasing the number of
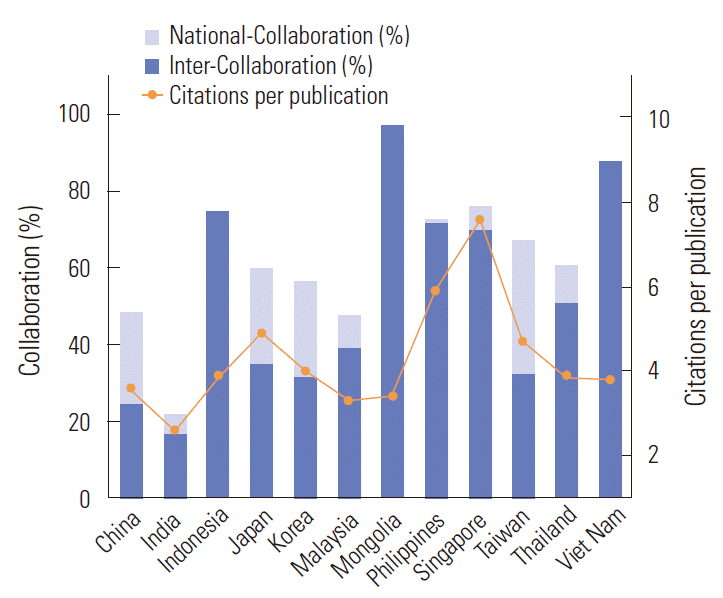
countries involved creates a linear increase in citations. Excepting a
few countries—Mongolia, Vietnam, and Indonesia—higher
inter-collaborationrate leads to a higher CPP rate (Fig. 12). Countries with higher international collaboration rate are relatively strong in technology compared to science.

/upload/thumbnails/se-1-2-62f12.gif

Fig. 12.

Collaboration rate (national and international) and citations per publication.
Download Figure
Among twelve countries, Mongolia is the most internationally collaborative country (Fig. 12).
International collaboration figures are larger for smaller and less
scientifically active countries. China’s publication growth has been the
most rapid, but many researchers need time to become established before
they are in a position to seek out collaborators. Japan has shown a
marginal increase in international collaboration over the past five
years. Relatively high level and growth of international collaboration
in Singapore may be one of key factors contributing to their increasing
citation impact. Compared to other European countries (the collaboration
rate in France is about 50%), Japan, China, Korea, India, and Taiwan
need to boost their collaboration rate to increase research impact.
The surprisingly high level of international
collaboration in some developing countries (e.g., 80% in Mongolia)
merits further inquiry. In Mongolia and Vietnam, high international
collaboration can imply low indigenous research capacity. Where local
institutions lack the necessary human and financial resource, foreign
scholars are generally the principal investigators that lead most of the
research conducted in such countries. Similar explanation can be
applied to other developing research economies, including many
Sub-Saharan African countries (Daniel Calto, private communication,
2014). Meanwhile, as a country begins to establish a stronger research
base or in-country capabilities that are critical for a country to
pursue independent research, international collaboration rates also
start to decline.
Increasing the number of Asian journals indexed in
global databases can contribute to enhancing the visibility of articles.
The higher CPP rate of individual countries can be related to the
number of journals indexed in Scopus. Though the Scopus database
includes non-science and technology disciplines, a higher number of
titles indexed from a particular country indicate higher visibility to
world readers. The share of journals from China and India indexed in
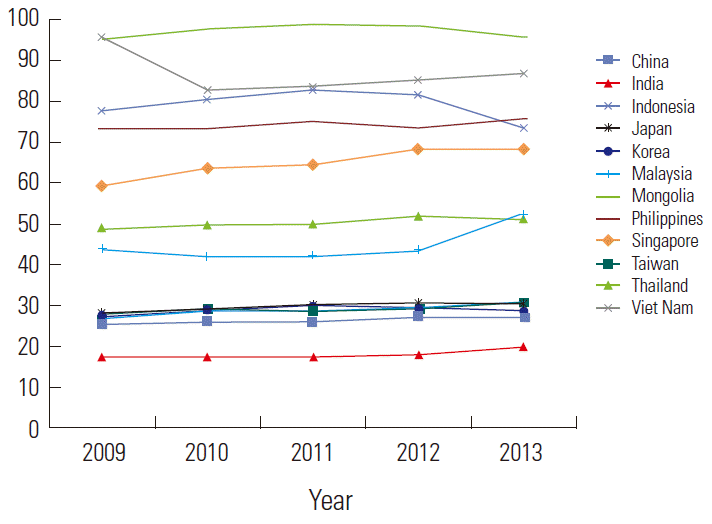
Scopus is rapidly growing, by 2.6% and 2.0%, respectively (Fig. 13).
The growth rate of indexed titles in Japan is the lowest among the
twelve Asian countries, because of the country’s well-developed
academia. Since 2009, indexed titles in Indonesia and Philippines have
increased by 32% and 31% respectively. Though the total number of
indexed titles may be marginal in these two countries, this growth is
expected to have a positive effect on increase of publication.

/upload/thumbnails/se-1-2-62f13.gif

Fig. 13.

Number of indexed titles by country in Scopus database.
Download Figure
The numbers of citations is entirely dependent on
citation culture of research fields, that is, different citation
patterns and different publication velocities. For this reason, when
comparing different fields it is recommended to use field-weighted
citation impact (FWCI) (Daniel Calto, private communication, 2014).
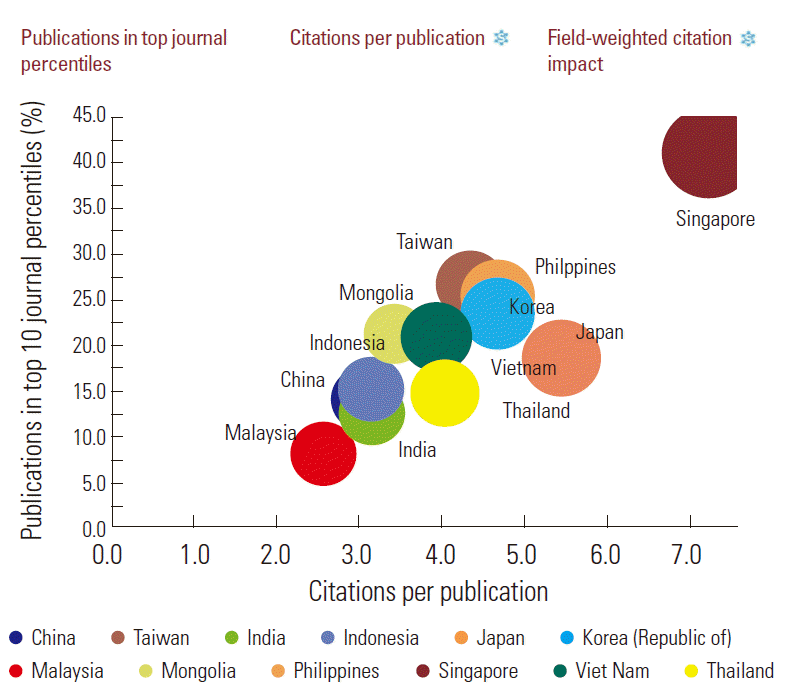
There is a linear relationship between percentiles of publications in
top journals (in science, technology and bioscience) and CPP, as shown
in Fig. 14.
This trend is also related to FWCI. For this work, we used FWCI as the
measure of citation impact. This is a measure of citation impact that
normalizes for differences in citation activity by subject field,
article type, and publication year. The world is indexed to a value of
1.00, meaning that values above 1.00 indicate above average citation
impact. More specifically, a citation impact of 1.52 indicates a
citation impact which is 52% above the average. This result might be
explained by the low quality of papers published by many Asian journals:
these papers are not referred to by many scholars worldwide. In the
future, however, low CPP rates in Asia would be improved by increasing
international collaboration and improving the visibility of articles by
indexed titles on international indexing databases.

/upload/thumbnails/se-1-2-62f14.gif

Fig. 14.

Relationship
between percentiles of publication in top journals (in science,
technology, and bioscience) and citations per publication.
Download Figure
In conclusion, this study finds that a predominant
number of research papers produced in developing Asian countries are in
technology, a field with a relatively short citation span than natural
science. Hence, most research papers produced in Asian regions appear to
have lower citation rates and are often devaluated. We suggest this
difference relates to the national development strategies or policy
priorities for individual states, which choose whether to invest
primarily on basic science or applied science. Further, this work
suggests that enhancing the accessibility and visibility of local
academic journals in Asian developing countries can be achieved by
understanding the characteristics of the disciplines of each country,
through collaboration with international projects for high CPP rates,
and by indexing titles on international indexing databases.
Go to : Goto

Conflict of Interest

No potential conflict of interest relevant to this article was reported.
Go to : Goto


References

1. National Science Board.
Science and engineering indicators 2014. Report no. NSB 14-01.
Arlington: National Science Foundation; 2014.

2. The Royal Society.
Knowledge, networks and nations: global scientific collaboration in the
21st century. Report no. 03/11 DES2096. London: The Royal Society; 2011.

Research output of science, technology and bioscience publications in Asia