Source: https://musingsaboutlibrarianship.blogspot.com/2019/09/the-rise-of-new-citation-indexes-and_5.html
For a librarian like me with a
basic (not expert) amount of bibliometric knowledge (and a bit of
googling + manual reading helps when trying to understand terms), this
is often sufficient to quickly generate a bibliometric map in 10
minutes flat (assuming you already have the required files exported from
citation indexes).
Admittedly the more I played with these tools, trying to understand why and how some types of networks could or could not be created based on the source file used, my understanding of such networks & how they were created improved.

That said, besides Dimensions and Microsoft Academic (which are potentially larger than Scopus and Web of Science in terms of items covered if not necessarily citation density), it's unclear to me how useful the other sources are useful because they are usually a lot smaller.
I did find one exception. I was doing visualization of all the papers authored by researchers from my institution using Scopus. As my institution has a heavy CS/IS component, when I used Semantic Scholar I found a richer map generated than Scopus or Web of Science as Semantic Scholar is strong on CS papers.

Like VOSviewer, Citespace is able to autocluster papers, authors etc. But one of the most useful tricks in Citespace is it is able to autolabel clusters using title/keyword/abstract (depending on the source of data you use and the type of map you generated), so it gives you a hint of what each cluster is about even if you don't recognise a single paper.
For instance, the graph below shows data generated by doing a basic search in Scopus using the query team creativity and exporting the full record in RIS. After some work converting the data to a suitable format, I chose to visualize the data using co-citations, aka a document co-citation network and then cluster.
The steps to do so can be a bit tricky, but there's a Youtube video here that walks you through each step.
I've hidden the labels for nodes and reduced the node to smaller sizes so the cluster labels come up more clearly.

As noted in the video, you can click on the buttons T, K, A to switch to use title, keyword or abstract respectively to generate the cluser labels. You may also change the algo used to generated cluster labels by clicking on the buttons, LSI, LLR, MI etc.
This doesn't always work as some data sources may not have abstract etc.

Citespace also has various views - a lot relating to time. I skipped over this but a unique point about Citespace is that it allows you to segment your analysis in time slices. Typically one year would be one slice but you can change this.
Like Vosviewer you can of course use color to represent time slices for example in the image below you can see some clusters are more yellow which are newer papers.

But you can go beyond that and "Step forward" in time using the time slider for each slice
 As
you go forward or backwards in the time you can see the linkages
appearing. The above image is set to the time slice 2008-2008 and you
can see the links appear on the top part of the graph.
As
you go forward or backwards in the time you can see the linkages
appearing. The above image is set to the time slice 2008-2008 and you
can see the links appear on the top part of the graph.
Incidently, the image above also has the tree ring option turned on as you can see some nodes are surrounded by rings of different colors , each representing years they were cited and thickeness representing the amount.
But perhaps a clear view is if you switch to a timeline view (two button from right). I've also hiddent the node labels just showing cluster labels.

Timeline view is nice if you want to see more clearly the interactions between each identified cluster. Coupled with the time slice feature, you can see for example in 2018, which papers and clusters they belong to were cocited.
This is really just scratching the surface and like VOSviewer, Citespace seems to be regularly updated.
In terms of the data sources supported for citation based visualizations, Citespace is pretty impressive supports quite a few formats (though some of them might just be term co-occurance maps rather than citation based?).

The ones I have tested includes WOS, Scopus,Dimensions and most recently Lens.org (see instructions).

Citespace is really powerful but in terms of learning curve it is way higher than VOSviewer. Part of it is because of the many options, but a big part of it is it simply isn't as user friendly. For instance to work with Scopus you need to go through a conversion process, while it works natively in VOSviewer.
Clicking on nodes in Citespace to get to papers or cited references often doesn't work. Or in some cases it does work but you won't realise it because it silently opened up a tab in the control panel window (but doesnt switch to it). This seems to occur quite a bit for various functions.
You can search for papers to add as "seed papers" or upload them via Zotero libraries and it will try to create relationships between the papers you entered.
The key here is that Citation Gecko is able to leverage citation links between seed papers (in yellow below) and other papers to help highlight possible papers of interest.
For instance it could reveal papers that were cited frequently by your seed papers (co-citations) or conversely papers that cited your seed papers a lot (bibliometric coupling) all with a single click.

The main difference between Citation Gecko and the other two is you can explore and expand your citation graph by adding nodes that are found (add as seed paper), while Vosviewer and Citespaceby and large are fixed maps based on what you exported from citation indexes. (though I see a SQL database option in Citespace).
Citation Gecko draws from Crossref and used to draw from Microsoft Academic.
Besides Google Scholar, Scopus and Web of Science, it also supports Crossref and Microsoft Academic and support for Dimensions might be on the way.

The rise of new citation indexes and the impact on Science mapping tools - Citespace, VOSviewer , Citation Gecko and more
Posted:2019-09-05 03:10:45 UTC+08:00
For a long time, there were just two main citation sources that spanned most disciplines, one provided by Web of Science and the other Scopus.
As I noted in past posts (here, here), this has changed in the last 2 years, new citation sources both proprietary such as Dimensions, and open such as OpenCitations Corpus have started to emerge.
At
the same time, I have recently became interested in the potential of
Science or bibliometric tools for aiding phd students who want to do
more sophisticated literature review.
As such, I've started to notice that the science mapping tools that are still in active development e.g. VOSViewer , Citespace or newer tools such as Citation Gecko
have started to respond to the trend of new emerging citation indexes
and started providing support of these new sources on top of the
traditional Web of Science and Scopus only.
Similarly the popular tool Publish or Perish by Anne-Wil Harzing which began by supporting extraction of results and citations from Google Scholar has now also grown now to support other citation indexes beyond Scopus or Web of Science.
Similarly the popular tool Publish or Perish by Anne-Wil Harzing which began by supporting extraction of results and citations from Google Scholar has now also grown now to support other citation indexes beyond Scopus or Web of Science.
In
this blog post, I will talk about some of the new indexes, Science
mapping tools are starting to support, and as an aside provide a brief
overview of what such tools can do and my first thoughts on them.
As it stands, it seems Microsoft Academic graph (due to it's size), Crossref (due to its openness) and Dimensions (Digital Science backed) are starting to be sources used by such tools.
As it stands, it seems Microsoft Academic graph (due to it's size), Crossref (due to its openness) and Dimensions (Digital Science backed) are starting to be sources used by such tools.
A warning, I'm still trying to figure out such tools, so chances are my understanding is incomplete!
Rise of open citations and emergance of new citation indexes
Creating a new citation index isn't easy. You not only need metadata such as article , title , abstract but you need the references in each item to construct the citation index. Let me detail some of the sources that have started to emerge that can be used to contruct citation indexes.
In the past 2 years, one of the major sources of such data has resulted from the efforts of I4OC - the intitative for Open Citations to get publishers to make such data open in Crossref.
The open citations in Crossref are made up of metadata received from publishers and made open for all. As I write this, roughly 60% of articles deposited by all publishers in Crossref has open citations.
Various organizations and tools have leveraged on this open citations including Dimensions, the literature finding tool Citation Gecko but notably it has been used by the OpenCitations organization to produce COCI, the OpenCitations Index of Crossref open DOI-to-DOI citations.
This supplements their existing OpenCitations Corpus (OCC) which works by parsing the XML source of Pubmed Central OA sources as well as the CROCI, the Crowdsourced Open Citations Index.
Indeed, an alternative way of obtaining data and citations is to crawl webpages and PDF and parse out the details.
As we all know perhaps the biggest source of data and citations has always been "available" via Google Scholar, which obtains such data by crawling , harvest and parse the data from webpages but unfortunately with the lack of an API this data is unaccessible for bulk use.
In the past 2 years, one of the major sources of such data has resulted from the efforts of I4OC - the intitative for Open Citations to get publishers to make such data open in Crossref.
The open citations in Crossref are made up of metadata received from publishers and made open for all. As I write this, roughly 60% of articles deposited by all publishers in Crossref has open citations.
How open is the scholarly citation graph today?— I4OC (@i4oc_org) September 3, 2019
Scholarly publications with #OpenCitations data have grown to 59% out of 47.6M articles with references deposited with Crossref.
Talk to your journal editor and publisher and help us get to 100%. https://t.co/fP55NSYJfw pic.twitter.com/kkWw7mD8t6
Various organizations and tools have leveraged on this open citations including Dimensions, the literature finding tool Citation Gecko but notably it has been used by the OpenCitations organization to produce COCI, the OpenCitations Index of Crossref open DOI-to-DOI citations.
This supplements their existing OpenCitations Corpus (OCC) which works by parsing the XML source of Pubmed Central OA sources as well as the CROCI, the Crowdsourced Open Citations Index.
Indeed, an alternative way of obtaining data and citations is to crawl webpages and PDF and parse out the details.
As we all know perhaps the biggest source of data and citations has always been "available" via Google Scholar, which obtains such data by crawling , harvest and parse the data from webpages but unfortunately with the lack of an API this data is unaccessible for bulk use.
But their tech rivals Microsoft has gone beyond this. Not only have they re-launched Microsoft Academic
their alternative to Google Scholar but also released the citation data
(no doubt obtained using similar methods as Google Scholar) dubbed Microsoft Academic Graph (MAG) as open data. As I noted in my past review of this set of data,
studies have indicated that the size of the data is truly massive
(currently it is at 200 million items) and is probably 2nd largest index
available next to Google Scholar
Beyond Crossref and MAG, other smaller sources of article metadata and citations exist and are available such as via Semantic Scholar, Wikidata/Wikicite, EuroPMC, and more.
With so many citation sources available and open (depending on your definition), citation indexes have started to emerge that blend such sources , some examples include the already mentioned Dimensions (Crossref plus additional closed sources), Lens.org (Crossref, Microsoft Academic, Pubmed), Scinapse (Microsoft Academic Graph , Semantic Scholar, Springer Nature SciGraph, PubMed), Scilit, ScienceOpen etc.
What follows will be a mini review of tools like VOSViewer, Citespace and show how they have started to incorporate these new sources or indexes. Other Science mapping or Scientometric analysis mapping tools exist (see also this topic page and this) but I haven't had the opportunity to study them closely.
VOSViewer - almost as easy as creating a word cloud
There
are two challenges to using bibliometric mapping tools. Firstly, you
need to have some basic understanding of the concepts. What's
bibliometric coupling network vs Cocitation network? What does
centrality mean? What does distances between clusters mean (if
anything).
The other challenge is usability,
most of the science mapping tools are shall we say not designed for ease
of use in mind. My guess is most of them are designed by the authors
for either own use primarily or for fellow bibliometricians and as such
as extremely powerful to use, but with correspondingly higher entry
barriers.
VOSViewer a Science mapping tools by Nees Jan van Eck and Ludo Waltman from CWTS is probably the only exception to the rule.
While it cannot solve the earlier problem, it does do well in trying to make things user friendly.
Rather then being open ended leaving the user to decide what buttons to press, at the start VOSViewer
guides you by prompting the options at each step. It also seems to
provide a lot of sensible defaults and I often could generate something
reasonable looking.
Admittedly the more I played with these tools, trying to understand why and how some types of networks could or could not be created based on the source file used, my understanding of such networks & how they were created improved.
In particular, the newer citation index Dimensions makes it almost seamless to use in Vosviewer (free version is limited to 2,500 results).

Exporting Dimension data for VOSviewer
Ways to use science mapping tools
Tools like VOSviewer
generally provide the main mapping features. Firstly one can feed it a
bunch of text and make it create a term co-occurance map. A typical use
is to feed it articles, and it will create a map of terms phrases with
words that tend to occur together appearing close to one another (or are
linked strongly to each other).
While
that can bring you some insights, the use cases I tend to look at is to
look at maps based on citation relationships which limits the number of
possible sources ie sources that include references and not just
title/author/abstract type metadata.
So
say you want to generate a map using bibliometric coupling or
cocitation of papers to look for interesting patterns. The easiest way
to do so is to search a citation index with keywords, export all the
results found (including references) into VOSviewer for visualization.
 Export records in Scopus - notice "include references" is checked
Another traditional use of tools like VOSviewer is to put out all papers by one institution and study patterns within.
While
they have always provided support to the main sources including Web of
Science , Scopus and Pubmed, since Jan 2019, they support the following
sources as well
- Dimensions
- Crossref
- Europe PMC
- Semantic Scholar
- OCC (Open Citation Corpus) & COCI (OpenCitations Index of Crossref open DOI-to-DOI)
- Wikidata
- Microsoft academic (new as of Sept 2019!)


Export records in Scopus - notice "include references" is checked
While
they have always provided support to the main sources including Web of
Science , Scopus and Pubmed, since Jan 2019, they support the following
sources as well
- Dimensions
- Crossref
- Europe PMC
- Semantic Scholar
- OCC (Open Citation Corpus) & COCI (OpenCitations Index of Crossref open DOI-to-DOI)
- Wikidata
- Microsoft academic (new as of Sept 2019!)

This is an amazing array of citation sources!


Co-authorship map of my institution Singapore Management University using Microsoft Academic data

Co-occurance map of my institution Singapore Management University using Microsoft Academic data and Field of Study as unit
That said, besides Dimensions and Microsoft Academic (which are potentially larger than Scopus and Web of Science in terms of items covered if not necessarily citation density), it's unclear to me how useful the other sources are useful because they are usually a lot smaller.
I did find one exception. I was doing visualization of all the papers authored by researchers from my institution using Scopus. As my institution has a heavy CS/IS component, when I used Semantic Scholar I found a richer map generated than Scopus or Web of Science as Semantic Scholar is strong on CS papers.
Quick summary of VOSviewer
VOSviewer is one among dozens of science mapping tools, however it is one of the easiest to use.
Sensible
defaults, a guided flow makes it such that one can generate a nice
looking map in a matter of minutes (less time downloading the files for
visualization).
For instance the map before was generated from data from Dimensions and visualized by VOSviewer
in less than 10 minutes. As this is a bibliometric coupled map, each
node is a paper from Dimensions and nodes that are near to each other
are more strongly related. By default size of node represents total
number of citations.
VOSViewer also automatically attempts to detect clusters of papers, which each color representing a cluster. In theory papers in each cluster is more related to each other than to papers not in the cluster.
VOSViewer also automatically attempts to detect clusters of papers, which each color representing a cluster. In theory papers in each cluster is more related to each other than to papers not in the cluster.

Bibliometric coupling of Dimensions (title and abstract) data exported with Board independence
You
can also show an alternative view with each color representing another
metric. In most cases, you would use the color as a heatmap to represent
year of publication. In some cases you may be able to see certain
clusters tend to be newer or older.

In the example above you can see the right most papers are mostly newer papers and these happen to be the purple cluster of papers from the earlier chart.
One of the nicer things about VOSviewer is that whether you are using Scopus,WOS, Dimensions, Microsoft Academic in most cases clicking on the nodes will bring you to a appropriate paper to learn more about the paper e.g. Publisher article page, Scopus record etc.
This is important because when you are new to the area all the node labels - Author (year) means nothing to you and you often find yourself clicking a few nodes in a cluster before you can figure out what each cluster kinda represents.
Citespace - a powerful yet difficult to use tool
On the other end of the spectrum we have CiteSpace by Chaomei Chen of Drexel University.
I
must admit when I first tried it , I couldn't even get it to run! But I
eventually was drawn back to trying it when I read about the
auto-labelling feature of Clusters.
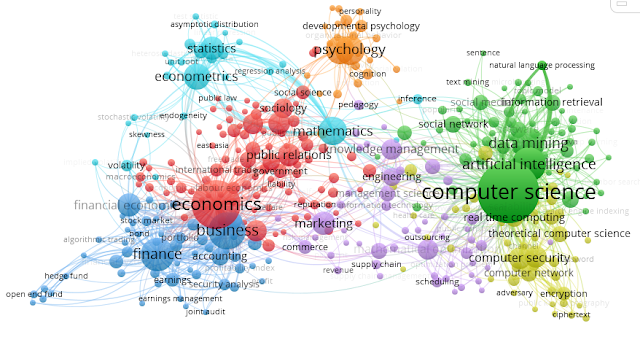
Like VOSviewer, Citespace is able to autocluster papers, authors etc. But one of the most useful tricks in Citespace is it is able to autolabel clusters using title/keyword/abstract (depending on the source of data you use and the type of map you generated), so it gives you a hint of what each cluster is about even if you don't recognise a single paper.
For instance, the graph below shows data generated by doing a basic search in Scopus using the query team creativity and exporting the full record in RIS. After some work converting the data to a suitable format, I chose to visualize the data using co-citations, aka a document co-citation network and then cluster.
The steps to do so can be a bit tricky, but there's a Youtube video here that walks you through each step.
I've hidden the labels for nodes and reduced the node to smaller sizes so the cluster labels come up more clearly.

Document Cocitation network visualized with CiteSpace from Scopus data (Team Creativity)
As noted in the video, you can click on the buttons T, K, A to switch to use title, keyword or abstract respectively to generate the cluser labels. You may also change the algo used to generated cluster labels by clicking on the buttons, LSI, LLR, MI etc.
This doesn't always work as some data sources may not have abstract etc.

In particular, I am generating a document cocitation map here. This means each
node represents a cited reference and not the indexed item from Scopus.
By default, the labels are generated using the citing items (aka the
indexed items) but by pressing on the Green CR button, you can change to
using the cited reference data itself.
You will find the CR button option doesn't work if you are using WOS data because for some reason WOS cited references do not contain article titles (try exporting and opening a file to see!).
The interesting side effect of playing around with these tools is my understanding of what fields are or are not exported from citation databases like WoS, Scopus, Dimensions improved!
Citespace does a ton more including having the ability to detect "citation bursts" (time windows where some articles suddenly got a lot of cites), show evolution of cluster labels over time (Cltr-Y) etc.
 Generating citation bursts list - you will need to click on the citation/frequency button first)


You will find the CR button option doesn't work if you are using WOS data because for some reason WOS cited references do not contain article titles (try exporting and opening a file to see!).
The interesting side effect of playing around with these tools is my understanding of what fields are or are not exported from citation databases like WoS, Scopus, Dimensions improved!
Citespace does a ton more including having the ability to detect "citation bursts" (time windows where some articles suddenly got a lot of cites), show evolution of cluster labels over time (Cltr-Y) etc.


Top 5 articles with Citation bursts
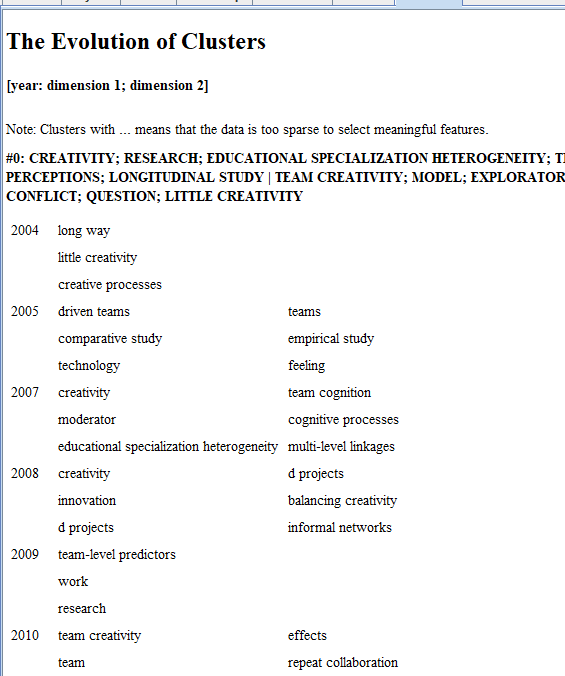
How cluster labels change over time where I selected it to show 2 labels per year.
Citespace also has various views - a lot relating to time. I skipped over this but a unique point about Citespace is that it allows you to segment your analysis in time slices. Typically one year would be one slice but you can change this.
Like Vosviewer you can of course use color to represent time slices for example in the image below you can see some clusters are more yellow which are newer papers.

But you can go beyond that and "Step forward" in time using the time slider for each slice

Incidently, the image above also has the tree ring option turned on as you can see some nodes are surrounded by rings of different colors , each representing years they were cited and thickeness representing the amount.
But perhaps a clear view is if you switch to a timeline view (two button from right). I've also hiddent the node labels just showing cluster labels.

Timeline view is nice if you want to see more clearly the interactions between each identified cluster. Coupled with the time slice feature, you can see for example in 2018, which papers and clusters they belong to were cocited.
This is really just scratching the surface and like VOSviewer, Citespace seems to be regularly updated.
In terms of the data sources supported for citation based visualizations, Citespace is pretty impressive supports quite a few formats (though some of them might just be term co-occurance maps rather than citation based?).

The ones I have tested includes WOS, Scopus,Dimensions and most recently Lens.org (see instructions).

Visualization using Lens as a source in Citespace
Citespace is really powerful but in terms of learning curve it is way higher than VOSviewer. Part of it is because of the many options, but a big part of it is it simply isn't as user friendly. For instance to work with Scopus you need to go through a conversion process, while it works natively in VOSviewer.
Clicking on nodes in Citespace to get to papers or cited references often doesn't work. Or in some cases it does work but you won't realise it because it silently opened up a tab in the control panel window (but doesnt switch to it). This seems to occur quite a bit for various functions.
Citation Gecko
I mentioned and reviewed this in the past so I won't belabour this. But this is probably by far the easiest to use even comparing with vosviewer.You can search for papers to add as "seed papers" or upload them via Zotero libraries and it will try to create relationships between the papers you entered.
The key here is that Citation Gecko is able to leverage citation links between seed papers (in yellow below) and other papers to help highlight possible papers of interest.
For instance it could reveal papers that were cited frequently by your seed papers (co-citations) or conversely papers that cited your seed papers a lot (bibliometric coupling) all with a single click.

Citation Gecko
The main difference between Citation Gecko and the other two is you can explore and expand your citation graph by adding nodes that are found (add as seed paper), while Vosviewer and Citespaceby and large are fixed maps based on what you exported from citation indexes. (though I see a SQL database option in Citespace).
Citation Gecko draws from Crossref and used to draw from Microsoft Academic.
Publish or Perish software
This isn't quite comparible with the other tools since it doesn't do visualizations, but I will include it here because like the other tools it has been expanding the sources it supports. As of version 7, it supports quite a few sources.Besides Google Scholar, Scopus and Web of Science, it also supports Crossref and Microsoft Academic and support for Dimensions might be on the way.

Sources you can use in Publish or Perish
Impact of new sources on tools
It's
difficult for new citation sources to get accepted compared to the
traditional big three - Scopus, Web of Science and Scopus.
These
indexes have the advantage of being widely used, analysed and over the
years have been refined and cleaned up from feedback of thousands of
users including librarians pointing out errors. It is thus difficult for
new sources to compete as they are not as trusted.
In a way such tools benefit from network effects , the more users use it and provide feedback the better it becomes.
Digital
Science backed Dimensions is making a go at it, by partnering with
institutions and making the data open for research by bonafide
researchers to increase confidence in the data.
Lastly,
as more tools particularly well known ones like Publish or Perish,
VOSviewer start supporting these tools, this further increase the
user-base and corresponding feedback from users
As
I write this bibliometrics researchers are having a field day comparing
these new sources against the usual big 3, but as most of these new
sources are open (with exception of Dimensions), it leads to a situation
where they have to decide how to deal with "blended indexes" like
Lens.org that consist of more than one open source.
Is
there any point in comparing say Lens.org (Microsoft
Academic+Crossref+others) with Scopus/WOS when you already have compared
Microsoft Academic? After all there is reason to suspect Microsoft
Academic dominates the results in Lens.org.
For example @CameronNevlon published a paper comparing Scopus, Web of Science and Microsoft academic and someone asked him about including Lens.org. His response?
For example @CameronNevlon published a paper comparing Scopus, Web of Science and Microsoft academic and someone asked him about including Lens.org. His response?
We haven't done the due dilligence but in principle @lensdotorg should be broadly the same as MSA. Now we have a way in need to look at BASE, CORE and others (particularly regional like AURA SciELo and AJOL)— CⓐmeronNeylon (@CameronNeylon) September 3, 2019
Similarly
should tool makers like VOSviewer, CiteSpace borther to support file
formats from Lens.org if they already support it's components sources
like Crossref and Microsoft Academic?
As it
stands, Microsoft Academic, Crossref and Dimensions seems to be the
"must support" sources these tools are trying to support, though things
might change.
No comments:
Post a Comment