In order to improve the quality of systematic researches, various tools have been developed by well-known scientific institutes sporadically. Dr. Nader Ale Ebrahim has collected these sporadic tools under one roof in a collection named “Research Tool Box”. The toolbox contains over 720 tools so far, classified in 4 main categories: Literature-review, Writing a paper, Targeting suitable journals, as well as Enhancing visibility and impact factor.
“I
have repeatedly stressed that the use of citation data in evaluating
individual performance is valid only as a starting point in a
qualitative appraisal.”
Eugene Garfield
TL;DR
• Many metrics attempt to measure what they call “influence” or “impact.”
• Most researchers and academic establishments use these metrics to make important and potentially life-changing decisions.
• However, most of these metrics were designed to help librarians choose subscriptions, not rank individuals.
• There is no single metric that can measure “quality” or “importance” of contribution to scientific knowledge.
• All measures should be used in conjunction and no important decisions should be made without a qualitative assessment.
Introduction
Measures
of scientific output and impact hold a pre-eminent role within
academia. Many researchers decide where to publish on the basis of
journal impact factor, many prestigious universities condition hires and
promotions on the h-index, many scientists use citation counts as a
guide to new and important literature, and even the US considers
citation counts in awarding certain visas.
These measures have gained so much popularity because of their perceived ability to measure scientific quality and impact
with relative ease. The current literature is too vast for any single
faculty, librarian or researcher to embark on an expedition to
qualitatively assess scientific output. However, very few of those using
these metrics actually understand what they represent, or their
caveats. Indeed, even though these measures have a substantial impact on
a scientist’s academic career, very few of us actually receive formal
training in what they are.
As
such, I compiled a quick pocket-guide to the top 10 such metrics (in
chronological order of creation) as a reference and some recommendations
on best practice. For a more detailed and comprehensive review, Agarwal
et al. (2016) is a good read.
Metrics
Publication count
Description.
This is the number of peer-reviewed publications for which an
individual is a listed author. Many institutions may place further
constraints on this, such as only counting first or last-author
publications listed on PubMed. Many prestigious institutions will
traditionally require more than a certain number (e.g. 25) of such
publications to consider a hire or promotion.
Purpose. This is primarily regarded as a measure of an author’s productivity, rather than a measure of their impact.
Pros. (1) A quick and easy measure of productivity.
Cons.
(1) It does not account for importance, impact, innovation or
usefulness of publications. (2) It does not account for the amount of
work that went into each paper; it may well be that a single paper by
one researcher is equivalent to two or three papers by another
researcher in terms of workload. (3) Citation frequency varies
dramatically with field of study; for example, a medical researcher has
on average far more citations than an econometrician; this varies with
norms, research activity and researchers in a field of science. (4) It
does not account for academically important but non-peer-reviewed work
(e.g. books). (5) It does not differentiate between types of papers
(e.g. an editorial vs a review vs original data). (6) It does not take
into account rate; a researcher can achieve 5 publications in 5 years or
in 30 years. (7) It does not translate well across disciplines (e.g. a
count of 20 may be considered relatively low in medicine, but extremely
high in mathematics). (8) Most publications of a researcher tend to
arise from work in which they were not the main contributors. (9) It
only increases, it never decreases, say with retractions. (10) It does
not discriminate between first/last authorship and in between.
Citation count
Description. Tracking citations was an idea first introduced by a couple of chemists at Pomona College (Gross and Gross, 1927; Bergstrom, 2007).
Citation count can refer to the number of citations of a peer-reviewed
publication, or the total number of citations across an author’s body of
work. As for publication count, citation count and its derivatives have
been widely used to assess publications, their authors and their
institutions.
Purpose.
This is primarily regarded as a marker of a publication’s or of an
author’s impact or influence, rather than their productivity (Agarwal et al., 2016; Yang and Meho, 2006).
However, as per Eugene Garfield, one of the founders of Scientometrics,
“Citation frequency is a measure of research activity, or of
communication about research activity. The measure is a sociometric
device. In itself, the number of citations of a man’s work is no measure
of significance. Like one scale on a nomogram, it
must be used along with other scales to obtain anything useful or
meaningful, particularly if the object of the evaluation is in any way
qualitative” (Garfield, 1973; an excellent read).
“The measure is a sociometric device. In itself, the number of citations of a man’s work is no measure of significance.”
Eugene Garfield
Pros. (1) A quick and easy estimate of an individual’s research activity.
Cons.
(1) Citation frequency varies dramatically with field of study; for
example, a medical researcher has on average far more citations than an
econometrician; this varies with norms, research activity and
researchers in a field of science. (2) Certain types of articles, such
as reviews and methods, tend to accumulate on average many more
citations than research articles. (3) Certain types of articles, such as
perspectives and editorials, tend to be very widely read, but rarely
cited. (4) Certain types of work, such as software development, tend to
be very widely used, but rarely cited (e.g. PubMed is very frequently
used in producing biomedical research, but rarely cited). (5) The
distribution of citation frequency tends to be very right skewed; in
fact, total author citation count tends to be dominated by a few very
highly cited publications. (6) Authors can game the system by
unnecessary self-citation (i.e. citing themselves). (7) It does not take
into account many activities of scientific value and impact, such as
teaching and leadership. (8) Most publications of a researcher tend to
arise from work in which they were not the main contributors. (9) It
only increases, it never decreases, say with a retraction. (10) The
older you are, the more publications you have and the more citations you
have. (11) Number of citations differs between providers (e.g. WOS,
Google Scholar, etc.) depending on the number and type of resources they
track. (12) An article is not necessarily cited strictly because of its
content — it could well be cited because of journal prestige, author
prestige, marketing. (13) It does not discriminate between first/last
authorship and in between. (14) Not all citations are favorable — for
example, the now retracted Wakefield et al. (1998)
article reporting on the association of the MMR vaccine with autism has
been cited more than 3000 times according to Google Scholar.
Journal Impact Factor (JIF)
Description.Eugene Garfield,
a professor at University of Pennsylvania and one of the founders of
Scientometrics, first proposed the use of the “impact factor” in 1955 (Garfield, 1955)
and eventually published the Science Citation Index (SCI), an index
mapping citations between journals, in 1961 with Irving H. Sher (Garfield, 2006).
SCI belongs to the Institute for Scientific Information (ISI) founded
by Garfield in 1960, acquired in 1992 by Thomson Reuters and eventually
spun off as Clarivate Analytics in 2016 (Clarivate Analytics also owns
Web of Science, EndNote and Publons). The Journal Impact Factor (JIF) is
calculated by dividing the number of citations to work published in the
two preceding years, by the number of citable publications in that
journal within those two years. For example, the 2018 JIF for a journal
is the total number of citations of its publications from 2016 and 2017,
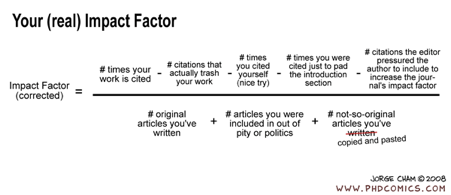
divided by the total number of publications in 2016 and 2017. Having
said that PhD Comics begs to disagree:
Purpose.
Garfield himself indicated that “Irving H. Sher and I created the
journal impact factor to help select additional source journals […] to
be covered in the new Science Citation Index (SCI)” (Garfield, 2006).
He went on to caution that the “use of journal impacts in evaluating
individuals has its inherent dangers. In an ideal world, evaluators
would read each article and make personal judgments. […] Most
individuals do not have the time to read all the relevant articles. Even
if they do, their judgment surely would be tempered by observing the
comments of those who have cited the work.” Unfortunately, JIF is
grossly misused in making hiring and promotion decisions in academia and
beyond by counting number of publications of faculty in journals with
high JIF (Bergstrom et al., 2008; Repanovici et al., 2016).
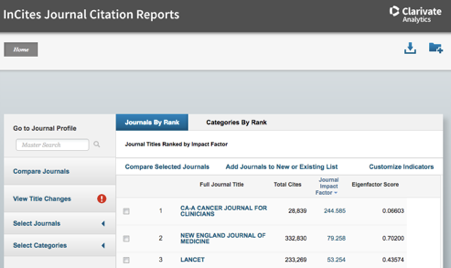
Website. Journal Impact Factors are officially calculated by Clarivate Analytics and published yearly at InCites Journal Citation Reports (paywalled). However, the 2019 list of JIFs may be accessed for free here.
Pros.
(1) A quick and simple measure to help librarians decide to which
journals their library should subscribe. (2) A quick and easy measure to
help researchers identify venues with a potentially larger audience for
their work.
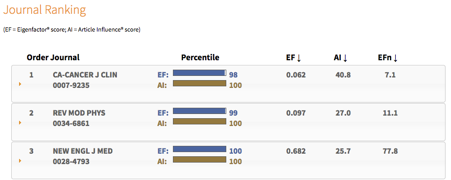
Cons
(1) JIF varies dramatically with field of study — fields such as
medicine possess journals with very high JIF, whereas fields such as
physics possess journals with very small JIF. (2) Journals that tend to
publish many review articles or guidelines, increase their JIF because
they tend to receive more citations; in fact, the journal with the
highest JIF, CA — A Cancer Journal for Clinicians,
only publishes such articles. (3) The amount of citations contributed by
each article within a journal varies dramatically and much of the JIF
may in fact come from very few super-cited articles (dramatic right
skew). (4) Disciplines vary in how quickly they produce new research —
the faster they produce research, the higher the JIF. (5) Journals can
and do game the JIF by making authors cite articles from their journal,
soliciting reviews and prioritizing articles on the basis of likely
potential attention rather than quality. (6) When used to evaluate
individuals, it does not differentiate between order of authors. (7) JIF
is self-perpetuating — journals with a high JIF tend to roughly
maintain or increase their JIF because they are preferred by authors and
readers (Ioannidis, 2018).
Notes. (1) Eugene Garfield provided his own review of the history and meaning of the Journal Impact Factor in 2006 in JAMA here
(paywalled). (2) JIF calculations do not include correspondence,
letters, commentaries, perspectives, news stories, obituaries
editorials, interviews or tributes. (3) JIF can also be used to evaluate
authors. (4) There are many variants of JIF trying to address several
of its shortcomings, such as the 5-year impact factor or the
source-normalized impact per paper (Crotty, 2017b).
h-index
Description. This was devised by UCSD physicist Jorge E. Hirsh (Hirsch, 2005). The h-index attempts to combine citation frequency with publication frequency; it is defined as the largest number h for which at least h articles of an author have been cited at least h
times. For example, an author with an h-index 5 has at least 5
publications that have been cited at least 5 times and 5 is the largest
such number for this author. This metric is gaining substantial
popularity, especially in the context of faculty promotion decisions.
Purpose.
This metric is treated by many as a combined marker of “productivity
and broad impact.” Hirsch devised this metric to “quantify the
cumulative impact and relevance of an individual’s scientific research
output.” However, he cautions that “a single number can never give more
than a rough approximation to an individual’s multifaceted profile, and
many other factors should be considered in combination in evaluating an
individual. […] Although I argue that a high h is a reliable indicator
of high accomplishment, the converse is not necessarily always true.”
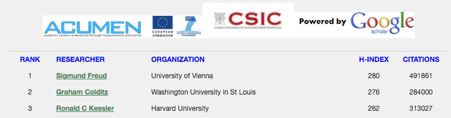
Website.Here is a sorted list of all 2610 authors with an h-index > 100 — Sigmund Freud leads the list with an h-index of 280.
Pros.
(1) A simple and quick combination of a researcher’s number of
peer-reviewed publications with their respective citation count. (2)
h-index plateaus with a decrease in publication rate, unlike other
measures, which can keep increasing. (3) Although self-citations still
matter, their effect is smaller than in citation counts; for example,
self-citations in an article with citations far exceeding h-index will
not contribute to its h-index. (4) A variable m
discussed in the original publication by Hirsch can be used to
standardize h-index by years of publication activity — as such, it can
be possible to compare scientists of similar publication age within the
same field. (5) It tends to be the metric that varies least between
different databases (Agarwal et al., 2016).
Cons.
(1) A poor cross-disciplinary measure because citation and publication
practices vary dramatically between fields; for example, medical
researchers would have, on average, a much higher h-index than
econometricians. (2) It favors older scientists because the longer a
scientist has been publishing, the more articles they have and the more
time they have had to accumulate citations. (3) A researcher with 5
publications each of 1000 citations will have an h-index of 5 and a
researcher with 20 publications each of 20 citations will have an
h-index of 20. (4) It only increases, it never decreases. (5) It does
not take into account many activities of scientific value and impact,
such as teaching and leadership. (6) Most publications of a researcher
tend to arise from work in which they were not the main contributors.
(7) It does not discriminate between first/last authorship and in
between.
Notes.
There are now many variants of the h-index, such as the Bh-index, which
attempts to adjust for few, but significant, publications (Bharathi, 2013).
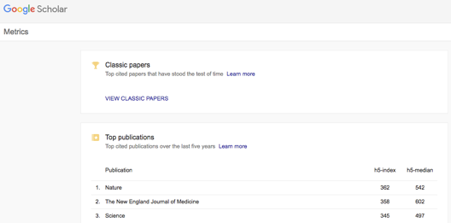
h5-index
Description.
This is an adaptation of the h-index to journals. It is defined as the
largest number h such that at least h articles in that journal were
cited at least h times each over the last 5 years. The most well-known
provider of h5-index is Google Scholar
Purpose. As above, but applied to journals.
Website.Here is a link of the top 100 publications in terms of h5-index by Google Scholar.
Pros.
(1) Less susceptible to the impact of predominant publication of
guidelines or reviews. (2) Less susceptible to a few super-cited
articles.
Cons.
(1) A poor cross-disciplinary measure because citation and publication
practices vary dramatically between fields; for example, medical
journals would have on average a much higher h-index than econometric
journals. (2) It favors journals with bigger citable content; for
example, PLoS One has a higher h5-index than Nature Neuroscience,
even though its JIF is much lower. (3) A journal with 5 articles of
1000 citations each will have an h5-index of 5 and a journal with 20
articles each of 20 citations will have an h5-index of 20. (4) It only
increases, it never decreases. (5) Many journals try to game the
h5-index using practices such as requesting that authors cite their
journal. (6) It can differ between databases, depending on what each
database tends to count as a citation or a publication.
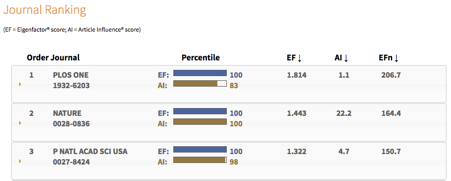
Eigenfactor Score
Description.
The Eigenfactor project was launched in January 2007 by Carl Bergstrom
(Department of Biology) and Jevin West (Information School) at the
University of Washington. Eigenfactor Score (a score for journals) and
the Article Influence Score (below; a score for articles) are
collectively known as the Eigenfactor Metrics. Eigenfactor Score is
based on “eigenvector centrality measures” and works in a similar
fashion to Google’s PageRank algorithm (itself inspired by Garfield’s work on citations; Bergstrom, 2007),
on the basis of which Google initially ranked search results. Briefly,
it first considers the network of citations between journals and
calculates the frequency with which an imaginary researcher would find
themselves at an article within a specific journal by following chains
of citation (Agarwal et al., 2016)
— the more frequently they find themselves at a specific journal, the
more influential that journal. Then, they divide a journal’s “influence”
by the number of citations from that journal’s articles to calculate
the journal’s weight; for example, an influential journal with many
review articles and thus many citations to other journals does not have
as high a weight as an influential journal with very few reviews and
thus not as many citations to other journals. Weight can be thought of
as the time spent at a journal: the more routes to that journal and the
less routes from that journal, the more time spent at the journal. It
finally considers the ratio of number of citations to the number of
articles published by a specific journal (in a similar fashion to JIF),
where each citation is weighted by the weight of the journal it came
from. Unlike JIF, which considers citations within the past 2 years,
Eigenfactor Score considers citations within the past 5 years.
“We
can view the Eigenfactor score of a journal as a rough estimate of how
often a journal will be used by scholars. The Eigenfactor algorithm
corresponds to a simple model of research in which readers follow
citations as they move from journal to journal. The algorithm
effectively calculates the trajectory of a hypothetical “random
researcher” who behaves as follows. Our random researcher begins by
going to the library and selecting a journal article at random. After
reading the article, she selects at random one of the citations from the
article. She then proceeds to the cited work and reads a random article
there. She selects a new citation from this article, and follows that
citation to her next journal volume. The researcher does this ad
infinitum. Since we lack the time to carry out this experiment in
practice, Eigenfactor uses mathematics to simulate this process. Because
our random researcher moves among journals according the citation
network that connects them, the frequency with which she visits each
journal gives us a measure of that journal’s importance within network
of academic citations. Moreover, if real researchers find a sizable
fraction of the articles that they read by following citation chains,
the amount of time that our random researcher spends with each journal
may give us a reasonable estimate of the amount of time that real
researchers spend with each journal.” From Eigenfactor’s website here.
Purpose.
According to the Eigenfactor website, they “launched the Eigenfactor
project in January 2007 in order to provide the scientific community
with what we believe to be a better method of evaluating the influence
of scholarly journals.” They also note that as “librarians work to meet
increasing subscription prices with increasingly constrained
subscription budgets, powerful measures of journal influence and journal
value may use fully supplement expert opinion and other sources of
information in making difficult decisions about journal holdings. Our
aim with the Eigenfactor project is to provide such a resource to the
library community.”
Pros.
(1) It accounts for where citations come from and weighs citations from
more influential journals more highly than those from less influential
journals. (2) It accounts for source of citation and weighs citations
from articles with few citations more highly than those from articles
with many citations. (3) It attempts to adjust for “citation culture”
between journals and across fields by placing less weight to citations
from articles with many citations. (4) Larger journals have larger
Eigenfactor scores as it considers the total value of all articles
published in a year by that journal. (5) Apparently it eliminates the
impact of self-citations.
Cons.
(1) Researchers often cite more established researchers and
better-regarded journals because of who they are (i.e. their status or
brand), not because they truly believe that their paper is more
influential. (2) It lines very well with raw citation counts, which is a
much simpler measure (Crotty, 2017b).
(3) Even though it attempts to minimize the drawbacks of citation
counts, it still relies heavily on them and thus largely suffers from
similar drawbacks (Crotty, 2017b).
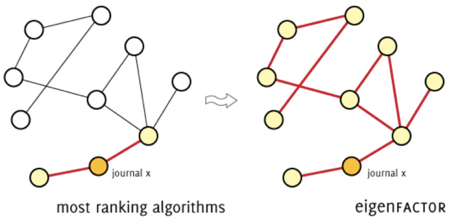
Article Influence Score
Description.
This is part of the Eigenfactor Metrics. It is the Eigenfactor Score
divided by the number of articles published in that journal and then
normalized so that the average article has an Article Influence Score of
1.
Purpose. As per Eigenfactor Score, but adjusted for the number of articles published by each journal.
Website. Journal ranking by Article Influence here.
Pros. (1)
Normalization makes articles of different journals immediately
comparable. (2) Roughly analogous to the 5-year JIF as it is a ratio of a
journal’s citation count to the number of articles it publishes.
Cons.
(1) Very few articles in each journal carry most citations, thus giving
two articles within the same journal an equal Article Influence Score
makes little sense. (2) Similar drawbacks to Eigenfactor Score.
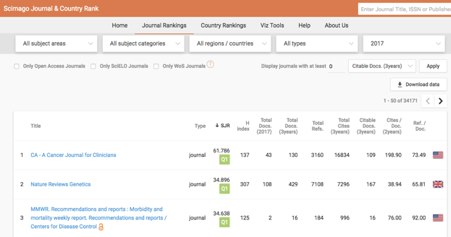
SCImago Journal Rank (SJR)
Description.
SCImago is “a research group from the Consejo Superior de
Investigaciones Científicas (CSIC), University of Granada, Extremadura,
Carlos III (Madrid) and Alcalá de Henares, dedicated to information
analysis, representation and retrieval by means of visualization
techniques.” SJR was made available online in 2008 (Butler, 2008)
and it works in a very similar fashion to Eigenfactor Score, with a few
differences: (1) it uses a 3-year window (unlike the 5-year window),
(2) it is based on the Scopus database (Eigenfactor Metrics depend on
WOS), (3) it is journal size-independent (Eigenfactor Metrics are
size-dependent), (4) it depends more on journal influence and less on
citation counts and (5) the value of a citation also depends on subject
field (González‑Pereira et al., 2010; Agarwal et al., 2016).
Purpose. As per the authors, this is “a size-independent indicator of journals’ scientific prestige” (González-Pereira et al., 2010).
Website. Access all journal and country SJR information here.
Pros. (1) As per Eigenfactor. (2) It uses more journals than the Eigenfactor.
Cons.
(1) As per Eigenfactor. (2) As anything based on citation, it is
impossible to know whether a study was cited for its scientific merit,
to be criticized or an entirely different reason. (3) Most, if not all,
of the additional journals on Scopus are of limited scientific value.
Notes. SCImago partners with Elsevier, as of 2010.
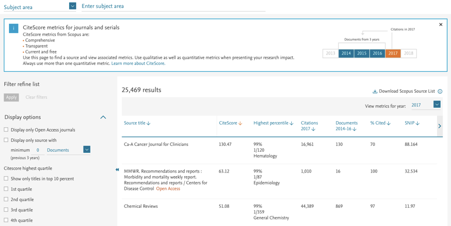
CiteScore
Description.
This is an alternative to JIF (of Clarivate Analytics) issued by
Elsevier’s Scopus in 2016 as part of a family of CiteScore metrics. It
works exactly like JIF, but instead: (1) it considers citations of
papers over 3 years rather than over 2 years, (2) pulls data from many
more journals than JIF and (3) counts citations to all articles
published in a journal (rather than only research articles). For more
differences visit Elsevier’s post here.
Purpose.
Elsevier indicates that CiteScore metrics introduce “a new standard
that gives a more comprehensive, transparent and current view of a
journal’s impact that will help you guide your journal more effectively
in the future.”
Website. CiteScore is freely available (unlike JIF) and can be found here.
Pros. (1) It alleviates bias introduced by having to decide whether a publication should be counted as a research article or not.
Cons.
(1) As per JIF. (2) Elsevier has been accused of being impartial in
creating CiteScore — by accounting for all published material, journals
of the Nature Publishing Group take a hit in comparison to their JIF,
whereas Elsevier journals benefit. Read this article on eigenfactor.org for further details.
Immediacy index
Description. The immediacy index is published by Clarivate Analytics, which notes here
that it is “the average number of times an article is cited in the year
it is published. It is calculated by dividing the number of citations
to articles [of a journal] published in a given year by the number of
articles published in that year.”
Purpose.
From the same website: “For a researcher, publishing in a journal with a
high Immediacy Index may increase the chances that his or her paper
will get noticed within a year of publication. For a publisher, the
Immediacy Index is an indicator that can be used to evaluate journals in
the immediate term. Immediacy Index can answer questions about the
speed of new content citation. Publishers can also compare Immediacy
Index to competing journals — is their material cited faster?”
Website. Immediacy index is officially calculated by Clarivate Analytics and published yearly at InCites Journal Citation Reports (paywalled).
Pros.
(1) A useful metric in identifying journals in fields with fast-paced
research. (2) It adjusts for journal size because it is a per-article
average.
Cons
(1) As per JIF. (2) “Frequently issued journals may have an advantage
because an article published early in the year has a better chance of
being cited than one published later in the year.” (3) The usefulness of
the immediacy index varies from field to field; for example, it may be
more relevant in medicine than in mathematics. Similarly, in fields like
biology, an article may have been read, but it may take more than a
year of it to be incorporated in new published work.
Altmetrics
Altmetrics were initially introduced in 2010 by the publication of the altmetrics manifesto.
Unlike more traditional measures of article influence or impact, which
are primarily based on citation activity, these primarily measure
article-specific web-based activity. For more information on altmetrics
and a quick video go here. For scholarly articles on altmetrics, PLoS maintains a collection of articles here. I hereby discuss the two most frequently encountered altmetrics, the Altmetric Attention Score and PlumX.
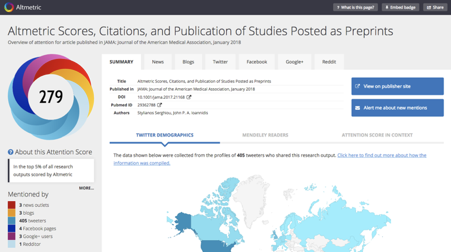
Altmetric Attention Score
Description.
This is a weighted count of all online activity in relation to a
specific publication captured by Altmetric (note that Altmetric is a
company producing altmetrics). These include mentions on social
networks, news articles, Wikipedia, policy documents, etc. (a
comprehensive list of sources here).
In addition to the overall number, Altmetric indicates the exact
records that have contributed to that count. The Altmetric Attention
Score is denoted as in the picture above, where each color other than
sky-blue refers to a source of mentions.
Purpose.
Altmetrics considers that AAS indicates “the volume and likely reach of
research’s attention, not quality or impact, at a glance.”
Website. All data held by Altmetric can be accessed for free using their API here. You can search for articles using their Altmetric Attention Score using the Dimensions database for free here.
Pros.
(1) It simplifies the total social attention of a research output into a
single value. (2) A useful map of all web-based social attention
directed to an article.
Cons.
(1) It is tempting to use this number out of context and without an
appreciation of what feeds into it. (2) The formula used to calculate
the score is not publicly available. (3) As far as I know, no academic
committee at the moment uses this score to make decisions about faculty
promotion. (4) Headline-grabbing articles can have a very high Altmetric
Attention Score, even though they may be of doubtful scientific quality
— for example, the now retracted Wakefield et al. (1998)
article reporting on the association of the MMR vaccine with autism has
an Altmetric Attention Score of 3626, which is one of the highest ever
recorded (99th percentile).
Notes. More pros and cons at Altmetric’s website here.
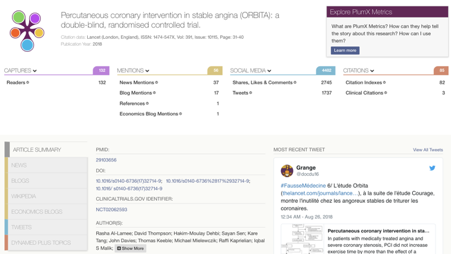
PlumX Metrics
Description.
Plum Analytics was founded in 2012. They track mentions of articles in
social media, such as Twitter and news outlets, much like Altmetric. In
addition to scores by Altmetric, it quantifies usage statistics (e.g.
number of views) and captures (i.e. whether someone indicated that they
want to return to a paper). In difference to Altmetric, it does not
provide an overall score. Plum Analytics has now been acquired by
Elsevier.
Stated purpose. As per Plum Analytics here,
“PlumX Metrics provide insights into the ways people interact with
individual pieces of research output (articles, conference proceedings,
book chapters, and many more) in the online environment.”
Website. The PlumX Dashboard can be accessed here (paywalled).
Pros. (1) A useful map of all web-based social attention directed to an article.
Cons.
(1) No overall weighted score provided to roughly compare between
articles. (2) As far as I know, no academic committee at the moment uses
this score to make decisions about faculty promotion. (3)
Headline-grabbing articles can score very highly across a number of
altmetrics, even though they may be of doubtful scientific quality.
Other metrics
There are many more other metrics. A few fun ones include the Erdos number, the Erdos-Bacon number and the Erdos-Bacon-Sabbath number (Stephen Hawking tops the list!), which calculate your degree of separation from the respective figures. arXiv Sanity Preserver features “top hype”, which collects all preprints on arXiv mentioned on Twitter over the last day.
Recommendations
All
aforementioned metrics measure some form of attention; “influence” and
“impact” are very ambiguous words. However, there is no metric that
directly assesses the likelihood of a scientific finding being true, the
likelihood of a specific scientist publishing a true finding or,
generally, which contribution to our scientific knowledge, let alone
overall prosperity, is likely most important. For example, even though
Sigmund Freud has the highest h-index of all time at 280, much of his
research has been discredited. Conversely, even though Einstein has
contributed fundamental true insights, he barely makes the cut for
individuals with an h-index above 100 at 106. Having said that,
highly-cited scientists have indicated that their most cited work tends
to align with what they think is their most important work (Ioannidis et al., 2014).
Nevertheless,
these measures should always be used in conjunction, if at all, to
quantify attention received and qualitatively appreciate what this
attention may mean. Academic decisions, such as hiring or promoting
faculty, should primarily depend on a qualitative assessment of name and
journal-blinded selections of a researcher’s work and should consider
all venues of possible scientific impact, not merely the peer-reviewed
literature. It is unfortunate that the current system has led many
scientists to primarily work just to increase that number.
Scientometricians have put together the Leiden Manifesto,
which was announced in Nature in 2015 and which lists 10 principles in
evaluating science using any kind of metric — here is a must-watch 4.5 minute video overview on it.
Acknowledgements
This
article was written after attending a journal club on scientometrics
(the study of measuring science) by Mark Musen at Stanford University.
Disclaimer
This
article may keep changing as I learn more about scientometrics. I
apologize for not mentioning metrics that you may think were important —
I only mentioned the ones I and, I think, most other people encounter
most frequently and for which I believe we as scientists should all have
a rudimentary knowledge and opinion. All reported h-index values were
taken from webometrics — all values based on citation and publication counts vary with database (i.e. Scopus vs WOS vs Google Scholar).
Additional resources
Wikipedia offers an overview of journal ranking methods here. Eugene Garfield’s website
offers an enormous wealth of information on scientometrics. The
Encyclopedia of Library and Information Science offers more details
about the initial development of citation counts here.
References
Agarwal
Ashok, Durairajanayagam Damayanthi, Tatagari Sindhuja, et al.
Bibliometrics: tracking research impact by selecting the appropriate
metrics. Asian J Androl. 2016;18(2):296–309
Bergstrom CT, West JD, Wiseman MA. The Eigenfactor Metrics. J Neurosci. 2008 Nov 5;28(45):11433–4
Bergstrom C. Eigenfactor: Measuring the value and prestige of scholarly journals. C&RL News. 2007 May;68(5):314–6
Bharathi DG (2013) Evaluation and Ranking of Researchers — Bh Index. PLoS ONE 8(12): e82050.
Butler D. Free journal-ranking tool enters citation market. Nature. 2008 Jan 2;451(6)
Crotty D. The Impact Factor. Eur Heart J. 2017 Aug 21;38(32):2456–7
Crotty D. Other Metrics: beyond the Impact Factor. Eur Heart J. 2017 Sep 14;38(35):2646–2647.
Garfield
E. Citation Indexes for Science: A New Dimension in Documentation
through Association of Ideas. Science. 1955 Jul 15;122(3159):108–11
Garfield E. The history and meaning of the journal impact factor. JAMA. 2006 Jan 4;295(1):90–3.
González‑Pereira
B, Guerrero‑Bote VP, Moya‑Anegón F. A new approach to the metric of
journals’ scientific prestige: the SJR indicator. J Informetr.
2010;4:379–91.
Gross PLK, Gross EM. College Libraries and Chemical Education. Science. 1927;66(1927): 385-9
Hirsch JE. An index to quantify an individual’s scientific research output. 2005 Nov 15;102(46):16569–72
Ioannidis
JPA. Massive citations to misleading methods and research tools:
Matthew effect, quotation error and citation copying. Eur J Epidemiol.
2018 Nov;33(11):1021–1023.
Patel
VM, Ashrafian H, Almoudaris A, Makanjuola J, Bucciarelli‑Ducci C, et
al. Measuring academic performance for healthcare researchers with the H
index: which search tool should be used? Med Princ Pract: int J Kuwait
Univ Health Sci Cent 2013; 22: 178–83.
Repanovici
A, Manuela AB, Stoianovici M, Roman N. Measuring the Quality and Impact
of Scientific Information Scientometry Research Using the Web of
Science in the Field of Ethics in Medical Recovery. Communication Today:
An Overview from Online Journalism to Applied Philosophy. 2016.
SCImago, (n.d.). SJR — SCImago Journal & Country Rank [Portal]. Retrieved 2018 Aug 8, from http://www.scimagojr.com
Wakefield
AJ, Murch SH, Anthony A, et al. Ileal-lymphoid-nodular hyperplasia,
non-specific colitis, and pervasive developmental disorder in children.
Lancet. 1998 Feb 28;351(9103):637–41.
Yang
K, Meho LI. Citation analysis: a comparison of Google Scholar, Scopus,
and web of science. Proc Am Soc Inf Sci Technol 2006; 43: 1–15.
MD
| PhD (Epidemiology)-MS (Statistics) student | Stanford University |
Meta-research, evidence-based medicine and health informatics using
machine learning
A growing directory of noteworthy altmetrics apps:
ImpactStory
ImpactStory
is a Web-based application that makes it easy to track the impact of a
wide range of research artifacts (such as papers, datasets, slides,
research code). The system aggregates impact data from many sources,
from Mendeley to GitHub to Twitter and more, and displays it in a
single, permalinked report.
ReaderMeter
ReaderMeter
is a mashup visualizing author-level and article-level statistics based
on the consumption of scientific content by a large population of
readers. Readership data is obtained via the Mendeley API. Reports are
available both as HTML and in a machine-readable version as JSON and are
released under a CC-BY-SA 3.0 license.
ScienceCard
ScienceCard
is a website that automatically collects metrics (citations, download
counts, altmetrics) for a particular researcher. All the researcher has
to do is provide a unique author identifier such as AuthorClaim or
Microsoft Academic Search ID.
PLoS Impact Explorer
The PLoS Impact Explorer allows you to browse the conversations collected by altmetric.com for papers published by the Public Library of Science (PLoS).
PaperCritic
PaperCritic
offers researchers a way of monitoring all types of feedback about
their scientific work, as well as allows everyone to easily review the
work of others, in a fully open and transparent environment.
Crowdometer
CrowdoMeter
is a web service that displays tweets linking to scientific articles,
and allows users to add semantic information. CrowdoMeter uses a subset
of the Citation Typing Ontology (CiTO),
an ontology for the characterization of citations, both factually and
rhetorically. The results of this crowdsourcing effort are displayed in
real-time.
Alert to readers. Some of this post covers ground I have been over before. See here, here and here. I plead guilty to self-plagiarism. Times Higher Education (THE)
is talking about a 3.0 version of its World University Rankings to be
announced at this year's academic summit in Toronto and implemented in
2021, a timetable that may not survive the current virus crisis. I will
discuss what is wrong with the rankings, what THE could do, and what it
might do. The
magazine has achieved an enviable position in the university rankings
industry. Global rankings produced by reliable university researchers
with sensible methodologies, such as the CWTS Leiden Ranking, University
Ranking by Academic Performance (Middle East Technical University) and
the National Taiwan University Rankings are largely ignored by the
media, celebrities and university administrators. In contrast, THE is
almost always one of the Big Four rankings (the others are QS, US News, and Shanghai Ranking), the Big Three or the Big Two and sometimes the only global ranking that is discussed. The exalted status of THE is remarkable
considering that it has many defects. It seems that the prestigious name
-- there are still people who think that is the Times newspaper
or part of it -- and skillful public relations campaigns replete with
events, workshops. gala dinners and networking lunches have eroded the
common sense and critical capacity of the education media and the
administrators of the Ivy League, the Russell Group and their imitators. There are few things more indicative of
the inadequacy of the current leadership of Western higher education
than their toleration of a ranking that puts Aswan University top of the
world for research impact by virtue of its participation in the Gates
funded Global Burden of Disease Study and Anadolu University top for
innovation because it reported its income from private online courses as
research income from industry. Would they really accept that sort of
thing from a master's thesis candidate? It is true that the "Sokal squared" hoax
has shown that that the capacity for critical thought has been
seriously attenuated in the humanities and social sciences but one would
expect better from philosophers, physicists and engineers. The THE world and regional rankings are
distinctively flawed in several ways. First, a substantial amount of
their data comes directly from institutions. Even if universities are
100% honest and transparent the probability that data will flow smoothly
and accurately from branch campuses, research centres and far flung
campuses through the committees tasked with data submission and on to
the THE team is not very high. THE has implemented an audit by PricewaterhouseCooper (PwC) but
that seems to be about "testing the key controls to capture and handle
data, and a full reperformance of the calculation of the rankings" and
does not extend to checking the validity of the data before it enters
the mysterious machinery of the rankings. PwC state that this is a
"limited assurance engagement." Second, THE is unique among the
well-known rankings in bundling eleven of its 13 indicators in three
groups with composite scores. That drastically reduces the utility of
the rankings since it is impossible to figure out whether, for example,
an improvement for research results from an increase in the number of
published papers, an increase in research income, a decline in the
number of research and academic staff, a better score for research
reputation, or some combination of these. Individual universities can
gain access to more detailed information but that is not necessarily
helpful to students or other stakeholders. Third,
the THE rankings give a substantial weighting to various input metrics.
One of these is income which is measured by three separate indicators,
total institutional income, research income, and research income from
industry. Of the other world rankings only the Russian Round University
Rankings do this. There is of course some relationship between funding and productivity but it is far from absolute and universal. The Universitas 21 system rankings,
for example, show that countries like Malaysia and Saudi Arabia have
substantial resources but so far have achieved only a modest scientific
output while Ireland has done very well in maintaining output despite a
limited and declining resource base. The established universities of the world seem to be quite happy with these income indicators which, whatever happens, are
greatly to their advantage. If their overall score goes down this can
be plausibly attributed to a decline in funding that can be used to
demand money from national resources. At a time when austerity has
threatened the well being of many vulnerable groups, with more suffering
to come in the next few months, it is arguable that universities are
not those most deserving of state funding. Fourth, another problem arises from THE
counting doctoral students in two indicators. It is difficult to see how
the number of doctoral students or degrees can in itself add to the
quality of undergraduate or master's teaching and this could act to the
detriment of liberal arts colleges like Williams or Harvey Mudd which
have an impressive record of produced employable graduates. These indicators may also have the
perverse consequence of forcing people who would benefit from a
master's or post graduate diploma course into doctoral programs with
high rates of non-completion. Fifthly,
the two stand alone indicators are very problematic. The industry
income indicator purports to represent universities' contributions to
innovation. An article by Alex Usher found that the indicator appeared to be based on very dubious data. See here
for a reply by Phil Baty that is almost entirely tangential to the
criticism. Even if the data were accurate it is a big stretch to claim
that this is a valid measure of a university's contribution to
innovation. The citations indicator which is
supposed to measure research impact, influence or quality is a disaster.
Or it should be: the defects of this metric seem to have passed
unnoticed everywhere it matters. The original sin of the citations
indicator goes back to the early days of the THE rankings after that
unpleasant divorce from QS. THE used data from the ISI database, as it
was then known, and in return agreed to give prominence to an indicator
that was almost the same as the InCites platform that was a big-selling
product. The indicator is assigned a weighting of
30% which is much higher than that given to publications and higher
than given to citations by QS, Shanghai US News or RUR. In fact
this understates the weighting. THE has a regional modification or
country bonus that divides the impact score of a university by the
square root of the impact score of the country where it is located. The
effect of this is that the scores of universities in the top country
will remain unchanged but everybody else will get an increase, a big one
for low scoring countries, a smaller one for those scoring higher.
Previously the bonus applied to the whole of the indicator but now it is
50%. Basically this means that universities are rewarded for being in a
low scoring country. The reason originally given for this was
that some countries lack the networking and funds to nurture citation
rich research. Apparently, such a problem has no relevance to
international indicators. This was in fact probably an ad hoc way of
getting round the massive gap between the world's elite and other
universities with regard to citations, much bigger than most other
metrics. The effect of this was to give a big
advantage to mediocre universities surrounded by low achieving peers.
Combined with other defects it has produced big distortions in the
indicator. This indicator is overnormalised.
Citation scores are based not on a simple count of citations but rather
on a comparison with the world average of citations according to year of
publication, type of publication, and academic field, over three
hundred of them. A few years ago someone told THE that absolute counting
of citations was a mortal sin and that seems to have become holy
scripture. There is clearly a need to take account of disciplinary
variations, such as the relative scarcity of citations in literary
studies and philosophy and their proliferation in medical research and
physics but the finer the analysis gets the more chance there is that
outliers will exert a disproportionate effect on the impact score. Perhaps the biggest problem with the THE
rankings is the failure to use fractional counting of citations. There
is an increasing problem with papers with scores, hundreds, occasionally
thousands of "authors", in particle physics, medicine and genetics.
Such papers often attract thousands of citations partly because of their
scientific importance, partly because many of their authors will find
opportunities to cite themselves. The result is that until 2014-15 a
university with a modest contribution to a project like the Large
Hadron Collider Project could get a massive score for citations
especially if its overall output of papers was not high and especially
if it was located in a country were citations were generally low. The
2014-15 THE world rankings included among the world's leaders for
citations Tokyo Metropolitan University, Federico Santa Maria Technical
University, Florida Institute of Technology and Bogazici University. Then THE introduced some reforms. Papers
with over a thousand authors were excluded from the citation count, the
country bonus was halved, and the source of bibliometric data was
switched from ISI to Scopus. This was disastrous for those universities that had over-invested in physics especially in Turkey, South Korea and France. The next year THE started counting the
mega-papers again but introduced a modified form of fractional counting.
Papers with a thousand plus papers were counted according to their
contribution to the paper with a minimum of five per cent. The effect of these changes was to
replace physics privilege with medicine privilege. Fractional counting
did not apply to papers with hundreds of authors but less than a
thousand and so a new batch of improbable universities started getting
near perfect scores for citations and began to break into the top five
hundred or thousand in the world. Last year these included Aswan
University, the Indian University of Technology Ropar, the University of
Peradeniya, Anglia Ruskin University, the University of Reykjavik, and
the University of Environmental and Occupational Health Japan. They did so because of participation in
the Global Burden of Disease Study combined with a modest overall
output of papers and/or the good fortunate to be located in a country
with a low impact score.
There is something else about the
indicator that should be noted. THE includes self-citations and on a
couple of occasions has said that this does not make any significant
difference. Perhaps not in the aggregate, but there have been occasions
when self-citers have in fact made a large difference to the scores of
specific universities. In 2009 Alexandria University broke into the top
200 world universities by virtue of a self-citer and a few friends. In
2017 Veltech University was the third best university in India and the
best in Asia for citations all because of exactly one self-citing
author, In 2018 the university had for some reason completely
disappeared from the Asian rankings. So here are some fairly obvious things that THE ought to do:
change the structure of the rankings to give more prominence to publications and less to citations
remove the income indicators or reduce their weighting
replace the income from industry indicator with a count of patents preferably those accepted rather than filed
in general, where possible replace self-submitted with third party data
if postgraduate students are to be counted then count master's as well as doctoral students
get rid of the country bonus which
exaggerates the scores of mediocre or sub-mediocre institutions because
they are in the poorly performing countries
adopt a moderate form of normalisation with a dozen or a score of fields rather than the present 300+
use full-scale fractional counting
do not count self citations, even better do not count intra-institutional citations
do not count secondary affiliations, although that is something that is more the responsibility of publishers
introduce two or more measures of citations.
But what will THE actually do? Duncan Ross, THE data director, has published a few articles setting out some talking points (here, here,here, here). He suggests that in the citation
indicator THE should take the 75th percentile as the benchmark rather
than the mean when calculating field impact scores. If I understand it
correctly this would reduce the extreme salience of outliers in this
metric. It seems that a number of new citations
measures are being considered with the proportion of most cited
publications apparently getting the most favourable consideration.
Unfortunately it seems that they are not going any further with
fractional counting, supposedly because it will discourage
collaboration. Ross mentions changing the weighting of the indicators but does not seem enthusiastic about this. He also discusses the importance of measuring cross-disciplinary research. THE is also considering the doctoral
student measures with the proportion of doctoral students who
eventually graduate. They are thinking about replacing institutional
income with "a more precise measure," perhaps spending on teaching and
teaching related activities. That would probably not be a good idea. I
can think of all sorts of ways in which institutions could massage the
data so that in the end it would be as questionable as the current
industry income indicator. It seems likely that patents will replace income from industry as the proxy for innovation. So it appears that there will be some
progress in reforming the THE world rankings. Whether it will be enough
remains to be seen.