Tuesday, 27 September 2022
Sunday, 25 September 2022
Weighted Aggregated Sum Product Assessment
Source: https://www.iieta.org/journals/mmep/paper/10.18280/mmep.090403
Weighted Aggregated Sum Product Assessment

Shahryar Sorooshian* | Noor Azlinna Azizan | Nader Ale Ebrahim
Page:
873-878
DOI:
https://doi.org/10.18280/mmep.090403

OPEN ACCESS
Abstract:
Multiple Criteria decision-making (MCDM) approaches are required for complex issue resolution. However, it is debatable whether MCDMs applicability will be able to stay within the analytical possibilities for dealing with divorce issues. As a result, one of the newly introduced MCDMs Weighted aggregated sum product assessment (WASPAS), is chosen for evaluation. Therefore, this study examined 388 documents from archive of the Scopus database. To evaluate the diversity of the technique's application, the data analysis looked at a few bibliometrics measures. So, the publishing hosts and their influence patterns are displayed, the vast majority of the documents were in the fields of engineering and computer science. According to the findings, the WASPAS can deal with variety of problem-solving scenarios. Hence, this work is summed up with the aim of lowering uncertainty among decision-makers and scholars.
Keywords:
multiple criteria decision-making (MCDM), weighted aggregated sum product assessment (WASPAS), literature analysis
formula.
(4) Qi=λQ(1)i+(1 - λ)Q(2)i is a generalized equation established in WASPAS for calculating the total relative significance of ith alternative, where λ is the combination parameter in the range of 0 to 1. WASPAS method is transformed into WPM when the value of λ is 0, and WSM method when it is 1. λ is been used to remedy MCDM issues in ranking accuracy.
A case is borrowed to practice the WASPAS MCDM, referencing an application of WASPAS from a reference [14] and simplified here. In a decision, there are 3 criteria (C1, C2 and C3), the first two of which is beneficial but the second one is cost-related (not beneficial). C1 and C2 are equal important, 25%, but C3 is more important, 50%. Based on MCDM WASPAS, the decision maker has 5 alternatives from which to choose. Their decision matrix in shown via Table 1, as step 1 of WASPAS. Normalization of all entries in the decision matrix in shown in Table 2, as WASPAS step 2.
Multiplying the relative importance of each criterion leads us to the next step of attribute optimization. For one, the first cell followed by WSM approach gives A1 as Q(1)i: =
=(5/5×0.25)+(3/5×0.25)+(8000/8500×0. 50). However WPM approach for A1 gives Q(2)i == (5/50.25) × (3/50.25) × (8000/85003. Results
As illustrated in Figure 1, the use of the WASPAS method in scientific documents is steadily expanding year after year, according to Scopus statistics. Among the WASPAS users, Edmundas Kazimieras Zavadskas from Vilnius Gediminas Technical University, who developed the method, was strongly top author listed based on the archived document number, with 11.4 percent of the documents. His university colleague, Jurgita Antucheviciene, was second listed with 3.9 percent of the documents, and another university colleague, Zenonas Turskis, was next with 3.3 percent of the documents.

Figure 1. Documents by year
Using the data of Figure 1, results Figure 2 with a non-linear regression equation based on the Power Model with N publications and A years of method’s age as A=0.03N^3.53; The response variable in a power mode non-linear regression is related to the factor increased to a power [20]. That outcome predicts, for instance, about 400 published documents are likelihood to be archived via Scopus in 2025. Plotting visualization of Figure 2 provides the fitting validation.

Figure 2. Publications prediction
Moreover, as shown in Figure 3, although Zavadskas leads the strongest earliest known network of co-authorship based on the collected documents, recent 2-3 years observed limited but new networks of newcomers. The overlay visualization of a co-authorship network was constructed based on 385 documents. In this visualization, the size of the circle represents the number of documents published. Each colony represents a group of researchers who works and published together.
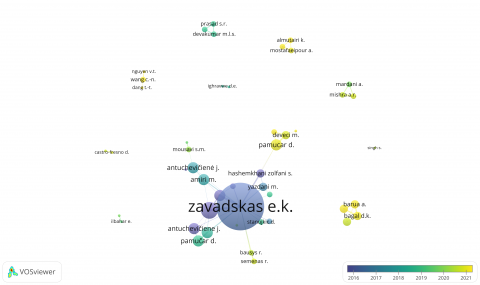
Figure 3. Overlay visualization of co-authorships
Table 4. Documents by study field
|
Study Field |
Documents |
|
Engineering |
171 |
|
Computer Science |
136 |
|
Mathematics |
76 |
|
Business, Management and Accounting |
68 |
|
Environmental Science |
59 |
|
Energy |
55 |
|
Social Sciences |
48 |
|
Decision Sciences |
41 |
|
Materials Science |
37 |
|
Economics, Econometrics and Finance |
26 |
|
Physics and Astronomy |
26 |
|
Chemistry |
15 |
|
Chemical Engineering |
13 |
|
Earth and Planetary Sciences |
9 |
|
Multidisciplinary |
5 |
|
Agricultural and Biological Sciences |
4 |
|
Medicine |
4 |
|
Biochemistry, Genetics and Molecular Biology |
3 |
|
Arts and Humanities |
2 |
|
Health Professions |
1 |
|
Neuroscience |
1 |
|
Psychology |
1 |
Figure 4 depicts an inference that demonstrates the capability of the WASPAS method to be used in conjunction with other MCDM methods such as AHP, TOPSIS, Entropy, SWARA, MOORA, COPRAS, as well as fuzzy sets and sensitivity analysis. It also shows the method’s applicability in various study areas such as risk management, sustainability research, location decisions, and wind power-related works. Furthermore, as illustrated in Figure 5, the variety of applications of the WASPAS decision-making method in diverse fields has grown in recent years.
In Figure 5, The density of utilized keywords over time is represented by color themes ranging from bright to dark, similar to a standard heat-maps. More to be discussed, even though the WASPAS method was created for decision-makers and based on applied mathematics, engineering and computer science are two of the method's most prominent users, accounting for 80 percent of the documents. Table 4 shows the distribution of the documents by study field. In addition, the statistics in this table demonstrates the method's broad applicability across more than 20 different fields.
Figure 6 looks at the top authors, keywords, and publishing journals and how they are linked. Figure 7, however, depicts the top ten countries with the most archived documents, and as can be seen, India dominates with nearly one-fourth of the count, followed by Iran. However, according to the data, some important scholarly actors, such as Japan, Austria, Finland, Norway, Vietnam, Ukraine, and a few others, are not yet WASPAS users.
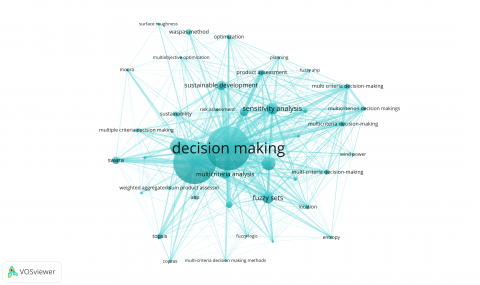
Figure 4. Network visualization of Keywords
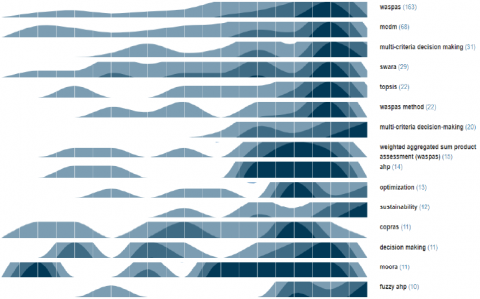
Figure 5. Keywords Evolution over time
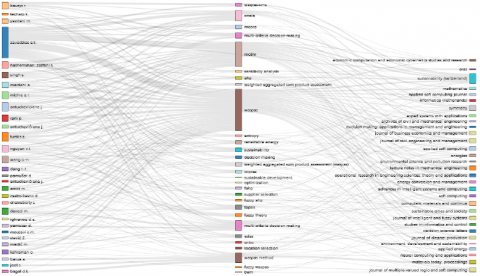
Figure 6. Authors, keywords, and journals
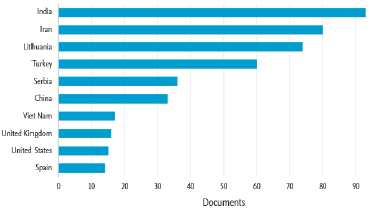
Figure 7. Documents by country
Saturday, 10 September 2022
The Impact of Article Length on the Number of Future Citations: A Bibliometric Analysis of General Medicine Journals
Source: https://journals.plos.org/plosone/article?id=10.1371/journal.pone.0049476
The Impact of Article Length on the Number of Future Citations: A Bibliometric Analysis of General Medicine Journals
- Matthew E. Falagas,
- Angeliki Zarkali,
- Drosos E. Karageorgopoulos,
- Vangelis Bardakas,
- Michael N. Mavros
x
- Published: February 6, 2013
- https://doi.org/10.1371/journal.pone.0049476
Abstract
Background
The number of citations received is considered an index of study quality and impact. We aimed to examine the factors associated with the number of citations of published articles, focusing on the article length.
Methods
Original human studies published in the first trimester of 2006 in 5 major General Medicine journals were analyzed with regard to the number of authors and of author-affiliated institutions, title and abstract word count, article length (number of print pages), number of bibliographic references, study design, and 2006 journal impact factor (JIF). A multiple linear regression model was employed to identify the variables independently associated with the number of article citations received through January 2012.
Results
On univariate analysis the JIF, number of authors, article length, study design (interventional/observational and prospective/retrospective), title and abstract word count, number of author-affiliated institutions, and number of references were all associated with the number of citations received. On multivariate analysis with the logarithm of citations as the dependent variable, only article length [regression coefficient: 14.64 (95% confidence intervals: (5.76–23.50)] and JIF [3.37 (1.80–4.948)] independently predicted the number of citations. The variance of citations explained by these parameters was 51.2%.
Figures
Citation: Falagas ME, Zarkali A, Karageorgopoulos DE, Bardakas V, Mavros MN (2013) The Impact of Article Length on the Number of Future Citations: A Bibliometric Analysis of General Medicine Journals. PLoS ONE 8(2): e49476. https://doi.org/10.1371/journal.pone.0049476
Editor: Santo Fortunato, Aalto University, Finland
Received: May 31, 2012; Accepted: October 11, 2012; Published: February 6, 2013
Copyright: © 2013 Falagas et al. This is an open-access article distributed under the terms of the Creative Commons Attribution License, which permits unrestricted use, distribution, and reproduction in any medium, provided the original author and source are credited.
Funding: These authors have no support or funding to report.
Competing interests: The authors have declared that no competing interests exist.
Introduction
An article's citations are considered a measure of the scientific recognition the study has received, and thus an indicator of its value and impact on the scientific field [1]. The citations are also the main factor determining the scientific impact of a journal, as expressed by the journal impact factor [2]. This indicator represents the mean number of citations received in an index calendar year, by all the citable articles published in a journal during the previous two years [3], [4]. Researchers commonly aim to publish articles that will attract citations and will thus be regarded to have a high scientific impact, as this may be associated with their career advancement.
Several studies have been conducted to explore the factors associated with the citation count of scientific articles. While the effect of journal impact factor [5]–[10] and study design [11]–[16] on citations received has been established by different studies, the published evidence on other potentially relevant variables, such as open access to the full text of the article, [17]–[20] or article length, [13] seems conflicting.
In this context, we aimed to examine the factors associated with the number of citations received by published articles, focusing on the article's length.
Methods
Data sources
Original human research articles published in the first trimester of 2006 in the 5 highest impact factor journals in the field of general and internal medicine were analyzed (the New England Journal of Medicine, the Lancet, the Journal of the American Medical Association, the Annals of Internal Medicine, and the British Medical Journal). Experimental studies, review articles, and meta-analyses were excluded. The 2006 journal impact factors were retrieved from the Thomson Reuters Journal Citation Reports. The number of citations to each article was last assessed in January 2012, according to the Thomson Reuters Web of Knowledge.
Data extraction
The abstract and/or full-text manuscript of each article was accessed to collect information regarding article length and characteristics that were reported to affect the number of citations in previous studies. Specifically, we documented variables comprised the number of authors and affiliated institutions, title and abstract word count, article length (as the number of pages), number of bibliographic references, study design (human or experimental studies; prospective or retrospective; interventional or observational), access to the article (open access or requiring subscription), and 2006 journal impact factor (JIF).
Figure 1. Correlation between the article length (number of print pages) and future article citations.
Results from the multivariate regression analysis. The dots represent the individual pairs for the X–Y variables; the straight line is the linear regression line; the dotted lines represent the 95% confidence interval for the regression line. The different journals with their individual IF are shown in different colours.
Data analysis and statistical methods
Statistical analyses were performed using SPSS Version 20.0. Initially, the association of each independent variable with the dependent variable (citation count) was assessed with univariate analyses (Mann-Whitney for categorical and Spearman's correlation for continuous variables); we used non-parametric methods, because citations of articles published in General Medicine journals are known to have a non-parametric distribution [21]. Variables significantly associated with the citation count in univariate analysis (p<0.10) were then entered in a backward multiple linear regression model to identify independent predictors of higher number of citations. The multiple linear regression model was also run with logarithmic transformation of the dependent variable (number of citations) to assess for a logarithmic, rather than linear relationship between the dependent and independent variables. Since the logarithmic transformed model performed better, only the results of this model were presented. To exclude the possibility of a false positive association between the article length and the number of authors and the number of citations, we repeated the multiple regression analysis separately for each of the journals, as the journal impact factor has been well established to be a major factor affecting citations.
All assumptions of linear regression were met by this model, including lack of error term correlation (Durbin-Watson = 2.013). Graphical examination of residuals did not suggest a violation of the linearity and normality assumption. Multicollinearity was deemed not important (VIF <5) for every independent variable. Homoscedasticity was checked by examination of the scatterplot of residuals and predicted values, and was met when outliers were excluded from the model. We also tested for outliers using added value and residual plots. Three outliers were identified with citations 1314, 1185 and 793, and were excluded. A variable was considered statistically significant if it had a p-value <0.05 in the final multivariable model.
Results
A total of 196 articles were analyzed. Experimental studies were excluded, leading to a total of 192 articles. The citation count varied from 5 to 1314 with a median of 96.5 (mean = 166). The majority of studies were prospective (67.2%), open-access (90.2%) and multi-center (67.2%). The most common type of study in our sample was that of a trial (39.6%, both randomized control trials and non-randomized trials). The study characteristics are presented in Table 1.
Table 1. Characteristics of the analyzed studies.
On univariate analysis, all tested independent variables except access (free versus restricted) and multicenter or single-center study, were found to have a statistically significant correlation to citations (Table 2). Therefore, the following variables were entered in the multivariate model: JIF, number of authors, article length, prospective or retrospective design, type of study (interventional or observational), abstract and title word count, number of affiliated institutions, and number of references, with the logarithm of the number of citations as the dependent variable.
Table 2. Results of statistical analysis.
A backward linear regression analysis was performed, removing insignificant independent variables one by one. Two variables were found to independently predict the number of citations: article length (number of pages) [regression coefficient (95% confidence interval): 0.079 (0.055–0.102), p<0.001; Figure 1and JIF [0.008 (0.004–0.013), p<0.001; Figure 2]. The variance of citations explained by these factors is 51.2% (adjusted R2 = 50.7%), p<0.001. The findings of the univariate and multivariate analyses are presented in table 2.
Figure 2. Correlation between the impact factor of the journal of publication and future article citations.
Results from the multivariate regression analysis. The dots represent the individual pairs for the X–Y variables; the straight line is the linear regression line; the dotted lines represent the 95% confidence interval for the regression line.
Subgroup analyses
For the subgroup of articles published in two of the five included journals, article length was found to be the only factor independently associated with citations, with a parameter estimate of 0.080 [(0.032–0.127), p = 0.002] and 0.058 [(0.013–0.104), p = 0.013], respectively. For articles published in the third journal, statistically significant factors included the number of institutions [0.050 (0.001–0.098), p = 0.04] and the number of references [0.014 (0.003–0.024), p = 0.01], while in the fourth journal significant were the number of authors [0.029 (0.006–0.051), p = 0.015] and the number of references [0.025 (0.011–0.040), p = 0.001)]. In the remaining journal, no variable was found to be significantly associated with citations, although that may reflect the smaller sample size (n = 23). Last, article length was significantly associated with the number of citations in the singe-center studies subgroup [0.109 (0.075–0.143), p<0.001].
Discussion
The main finding of this study is that the article length and journal impact factor are independently associated with the number of citations received by each article. Although several previous studies have reported that the journal impact factor is associated with the article citations, this is the first study, to the best of our knowledge, to report a positive association between the article length and the article citations after adjustment for several potentially confounding variables, such as the study design, prospective or retrospective nature of the study, abstract and title word count, number of author–affiliated institutions and number of bibliographic references. Specifically, we found an increase by an average of 0.079 in the logarithm of citations per article for each additional page, 0.008 for every unit of increase in the journal impact factor. The greater article length could reflect increased greater scientific complexity and higher methodological quality of a study; in addition, lengthier articles are expected to contain more information, thus increasing the possibilities that part of it will be appropriate to be cited by other researchers. Furthermore, in lengthier compared with shorter articles, the study methodology and findings could be more clearly and elaborately presented and discussed, and can therefore have a greater impact. It should be highlighted that our findings probably do not apply to long articles where the results have been improperly “inflated”; after all, some of the greatest discoveries in science have been described only briefly [22].
A few studies have assessed, albeit not comprehensively, the impact of the article length on future citations. In the field of Astronomy and Astrophysics, lengthier articles were cited more often in some journals [23]. In the fields of Infectious Diseases, Clinical Microbiology and Antimicrobial Agents, brief reports were cited less often than full articles, even after adjustment for the journal impact factor [24]. This was not the case in another study assessing 504 articles and adjusting for several confounding factors [13]. In contrast to our study, in which we assessed only original study articles, the authors included in their analysis numerous Cochrane reviews and reports from the Technology Assessment database (n = 108), that are typically lengthy; in addition, they excluded articles not meeting specific methodological and clinical relevance criteria. That study reported a slightly negative correlation between the article length and the number of citations received [−0.11 (−0.02 to −0.01)]; however, when Cochrane reviews and reports from the Technology Assessment database were excluded, no association between the article length and citations was identified. Although the difference between these findings and those of our study is probably attributed to the difference in the type of articles assessed (inclusion/exclusion of review articles), it remains to be proven whether our findings can be generalized to a larger part of the biomedical literature than just the 5 highest impact factor journals in General & Internal Medicine.
In addition to the number of print pages, we found that the impact factor of the journal and the number of authors were associated with the citation count. Although we limited our analysis only to articles from high impact factor journals, the articles published in the highest impact factor journals were cited significantly more often. It should be noted that we used the 2006 journal impact factor (that refers to articles published in 2004 and 2005) for our analysis (that referred to articles published in 2006) to avoid a potential bias. In this regard, our findings are in concordance with previous studies that found the journal impact factor to be a major predictor of the article citation count [5]–[10].
Several other variables assessed in previous studies were incorporated in our analysis, but failed to show a statistically significant association with the number of citations. The characteristics and findings of all relevant studies are briefly presented in Table 3. Some authors have described an association between the type of the study and the future citations, with more citations received by meta-analyses and randomized control trials and less citations received by observational studies [11], [12], [14], [16]; their findings are have been limited by selection bias (articles of a specific specialty) [11], [12], [14], [16] and inappropriate adjustment of confounding factors [16]. Such findings were not verified in our analysis, as we found no citation advantage neither for interventional over observational studies, nor for any specific type of study (trial, cohort, cross-sectional or case-control); however, this could also be attributed to the relatively small sample size of each subset of articles of different study type. It has been debated whether open access distribution of articles leads to more citations [18]–[20], [25], [26] or that scientific collaboration positively influence citation count [13], [15], [27]; we did not confirm such an association. Last, we did not observe a significant impact of the title length (word count) on the future citations, in contrast to what other researchers have found [25], [26]. This may be attributed to the lack of adjustment for confounding factors by those studies.
Table 3. Published studies examining factors that affect citations.
Our study is subject to certain limitations. First, it is characterized by selection bias, as the articles published in high impact factor journals in General Medicine may not be representative of all published articles; for example, they are more likely to be multi-center RCT than a single-center case-control study. Second, although our results are statistically significant, it is possible that the association does not represent a causal relationship. Third, we did not assess the analyzed articles regarding topic [11], [15], [16], paper quality [9], [10], funding [15], [18] or country of origin of the authors [7], [18], which are factors that have been found to affect citations by other authors. Last, in our assessment of article length, we only analyzed page count (not word count) and inter-journal variance in the number of words per page cannot be excluded.
In conclusion, for original research articles published in the major General Medicine journals, in addition to journal impact factor, the article length independently predicts the number of future citations. This probably reflects a higher complexity level and quality of longer studies and does not apply to inappropriately inflated articles. Additional studies are warranted to verify the generalizability of our findings to a largest part of the biomedical literature.
Author Contributions
Conceived and designed the experiments: MEF DEK. Performed the experiments: AZ VB. Analyzed the data: VB MNM. Contributed reagents/materials/analysis tools: MEF AZ DEK MNM. Wrote the paper: MEF AZ DEK VB MNM.
References
- 1. Cheek J, Garnham B, Quan J (2006) What's in a number? Issues in providing evidence of impact and quality of research(ers). Qual Health Res 16: 423–435.
- 2. Falagas ME, Kouranos VD, Arencibia-Jorge R, Karageorgopoulos DE (2008) Comparison of SCImago journal rank indicator with journal impact factor. FASEB J 22: 2623–2628.
- 3. Falagas ME, Alexiou VG (2008) The top-ten in journal impact factor manipulation. Arch Immunol Ther Exp (Warsz) 56: 223–226.
- 4. Garfield E (1996) How can impact factors be improved? BMJ 313: 411–413.
- 5. Perneger TV (2010) Citation analysis of identical consensus statements revealed journal-related bias. J Clin Epidemiol 63: 660–664.
- 6. Etter JF, Stapleton J (2009) Citations to trials of nicotine replacement therapy were biased toward positive results and high-impact-factor journals. J Clin Epidemiol 62: 831–837.
- 7. Filion KB, Pless IB (2008) Factors related to the frequency of citation of epidemiologic publications. Epidemiol Perspect Innov 5: 3.
- 8. Nieminen P, Carpenter J, Rucker G, Schumacher M (2006) The relationship between quality of research and citation frequency. BMC Med Res Methodol 6: 42.
- 9. Montori VM, Wilczynski NL, Morgan D, Haynes RB (2003) Systematic reviews: a cross-sectional study of location and citation counts. BMC Med 1: 2.
- 10. Callaham M, Wears RL, Weber E (2002) Journal prestige, publication bias, and other characteristics associated with citation of published studies in peer-reviewed journals. JAMA 287: 2847–2850.
- 11. Okike K, Kocher MS, Torpey JL, Nwachukwu BU, Mehlman CT, et al. (2011) Level of evidence and conflict of interest disclosure associated with higher citation rates in orthopedics. J Clin Epidemiol 64: 331–338.
- 12. Willis DL, Bahler CD, Neuberger MM, Dahm P (2011) Predictors of citations in the urological literature. BJU Int 107: 1876–1880.
- 13. Lokker C, McKibbon KA, McKinlay RJ, Wilczynski NL, Haynes RB (2008) Prediction of citation counts for clinical articles at two years using data available within three weeks of publication: retrospective cohort study. BMJ 336: 655–657.
- 14. Bhandari M, Busse J, Devereaux PJ, Montori VM, Swiontkowski M, et al. (2007) Factors associated with citation rates in the orthopedic literature. Can J Surg 50: 119–123.
- 15. Kulkarni AV, Busse JW, Shams I (2007) Characteristics associated with citation rate of the medical literature. PLoS One 2: e403.
- 16. Patsopoulos NA, Analatos AA, Ioannidis JP (2005) Relative citation impact of various study designs in the health sciences. JAMA 293: 2362–2366.
- 17. Kim HE, Jiang X, Kim J, Ohno-Machado L (2011) Trends in biomedical informatics: most cited topics from recent years. J Am Med Inform Assoc 18 Suppl 1i166–170.
- 18. Lansingh VC, Carter MJ (2009) Does open access in ophthalmology affect how articles are subsequently cited in research? Ophthalmology 116: 1425–1431.
- 19. Davis PM, Lewenstein BV, Simon DH, Booth JG, Connolly MJ (2008) Open access publishing, article downloads, and citations: randomised controlled trial. BMJ 337: a568.
- 20. Eysenbach G (2006) Citation advantage of open access articles. PLoS Biol 4: e157.
- 21. Falagas ME, Kouranos VD, Michalopoulos A, Rodopoulou SP, Batsiou MA, et al. (2010) Comparison of the distribution of citations received by articles published in high, moderate, and low impact factor journals in clinical medicine. Intern Med J 40: 587–591.
- 22. Watson JD, Crick FH (1953) Molecular structure of nucleic acids: a structure for deoxyribose nucleic acid. Nature 171: 737–738.
- 23. Ball P (2008) A longer paper gathers more citations. Nature 455: 274–275.
- 24. Mavros M, Bardakas V, Rafailidis P, Sardi T, Demetriou E, et al. (2013) Comparison of number of citations to full original articles versus brief reports. Scientometrics 94(1): 203–206.
- 25. Habibzadeh F, Yadollahie M (2010) Are shorter article titles more attractive for citations? Cross-sectional study of 22 scientific journals. Croat Med J 51: 165–170.
- 26. Jacques TS, Sebire NJ (2010) The impact of article titles on citation hits: an analysis of general and specialist medical journals. JRSM Short Rep 1: 2.
- 27. Figg WD, Dunn L, Liewehr DJ, Steinberg SM, Thurman PW, et al. (2006) Scientific collaboration results in higher citation rates of published articles. Pharmacotherapy 26: 759–767.
- 28. Perneger TV (2004) Relation between online “hit counts” and subsequent citations: prospective study of research papers in the BMJ. BMJ 329: 546–547.
Subscribe to:
Posts (Atom)