Source: https://leidenmadtrics.nl/articles/halt-the-h-index
 Photo by Nick Wright on Unsplash
 Halt the h-index
Using the h-index in research evaluation? Rather not. But why not, actually? Why is using this indicator so problematic? And what are the alternatives anyway? Our authors walk you through an infographic that addresses these questions and aims to highlight some key issues in this discussion.
Sometimes, bringing home a message requires a more visual
approach. That’s why recently, we teamed up with a graphic designer to
create an infographic on the h-index – or rather, on the reasons why not to use the h-index.
In our experience with stakeholders in research evaluation, debates about the usefulness of the h-index
keep popping up. This happens even in contexts that are more welcoming
towards responsible research assessment. Of course, the h-index
is well-known, as are its downsides. Still, the various issues around
it do not yet seem to be common knowledge. At the same time, current
developments in research evaluation propose more holistic approaches.
Examples include the evaluative inquiry developed at our own centre as well as approaches to evaluate academic institutions in context. Scrutinizing the creation of indicators itself, better contextualization has been called for, demanding to derive them out “in the wild” and not in isolation.
Moving towards more comprehensive research assessment approaches that consider research in all its variants is supported by the larger community of research evaluators as well, making a compelling case to move away from single-indicator thinking.
Still, there is opposition to reconsidering the use of metrics. When first introducing the infographic on Twitter, this evoked responses questioning misuse of the h-index
in practice, disparaging more qualitative assessments, or simply
shrugging off responsibility for taking action due to a perceived lack
of alternatives. This shows there is indeed a need for taking another
look at the h-index.
The h-index and researcher careers
To begin with, the h-index only increases as time passes. This time-dependence means that the h-index favors more senior researchers over their younger colleagues. This becomes clearly apparent in the following (fictitious) case, which compares a researcher at a more advanced career stage to an early-career researcher. As can be seen in Figure 1, the researcher at the more advanced career stage has already published a substantial number of publications.
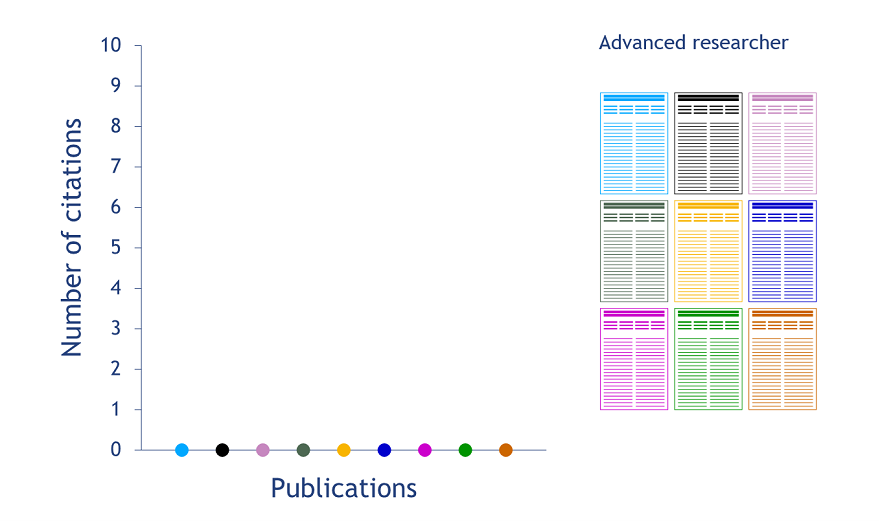
Figure 1. Publications of a researcher at a more advanced career stage. Publications can be seen on the x-axis and are represented on the right as well.
Over time, the publications depicted attract more and more citations (see the y-axis in Figure 2).
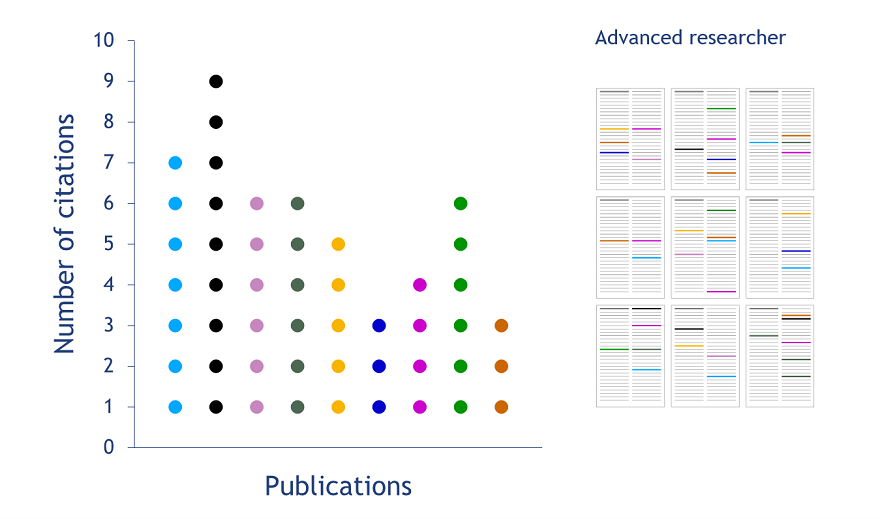
Figure 2. Citations for publications of a researcher at a more advanced career stage. On the right: colored representations of citations received as they occur in other publications.
When ordering a researcher’s list of publications by the (decreasing) number of citations received by each of them, you will get a distribution as in Figure 3. The value of the h-index equals the number of publications (N) that have received N or more citations. In our example, this results in an h-index of five.
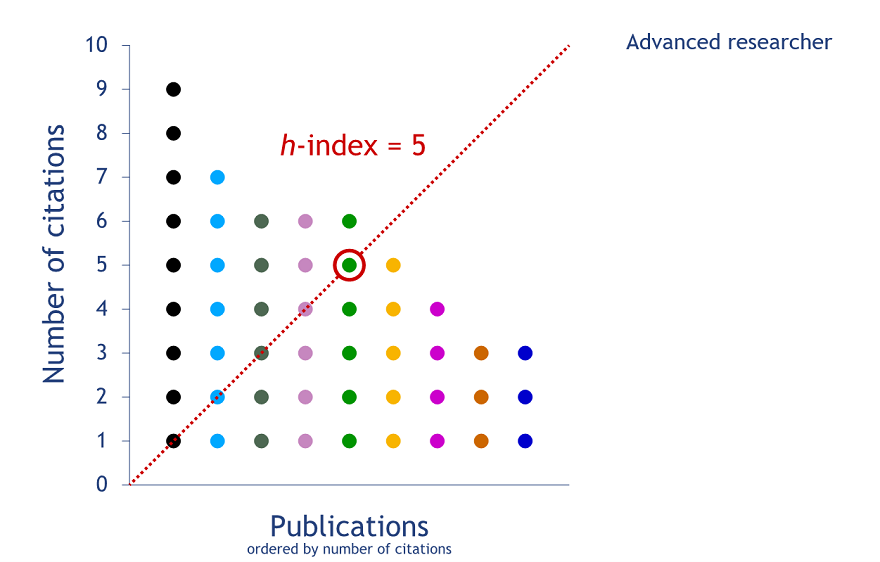
Figure 3. Calculating the h-index for a researcher at a more advanced career stage
The situation is less favorable for the early-career researcher. This is because the h-index does not account for academic age: researchers who have been around for a shorter amount of time fare worse with this metric. Hence, while the h-index provides an indication of a researcher’s career stage, it does not enable fair comparisons of researchers that are at different career stages.
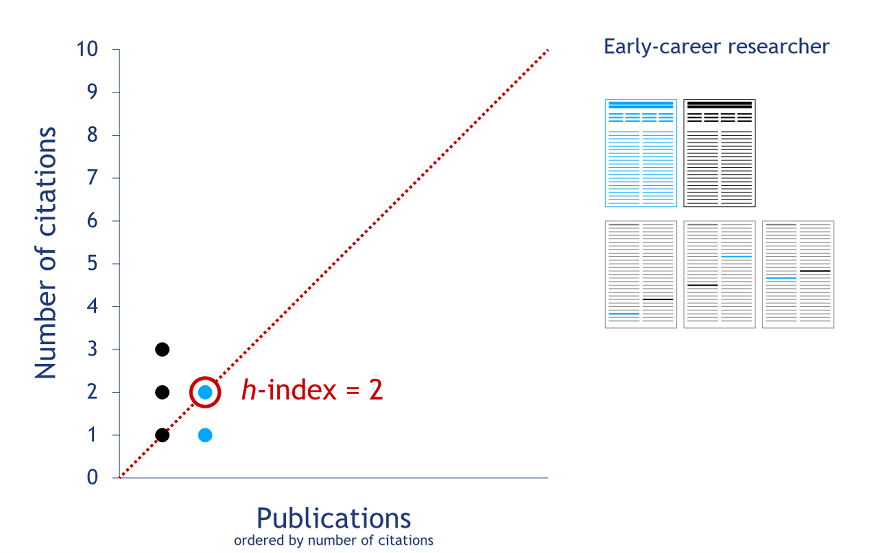
Figure 4. Calculating the h-index for an early-career researcher.
The h-Index and field differences
Another problem of the h-index is that it does not account for differences in publication and citation practices between and even within fields. A closer look at another hypothetical case may exemplify this issue. We are taking a look at two different fields of science: One with a low (Figure 5) and another one with a high publication and citation density (Figure 6). The researcher in the field with a low publication and citation density has an h-index of two, while the h-index equals five for the researcher in the field with a high publication and citation density. The difference in the h-indices of the two researchers does not reflect a difference in scientific performance. Instead, it simply results from differences in publication and citation practices between the fields in which the two researchers are active.
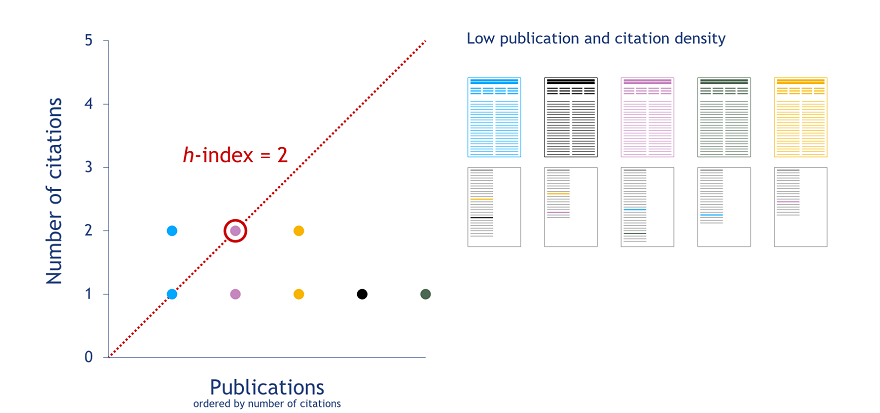
Figure 5. Calculating the h-index for a researcher active in a field with a low publication and citation density.
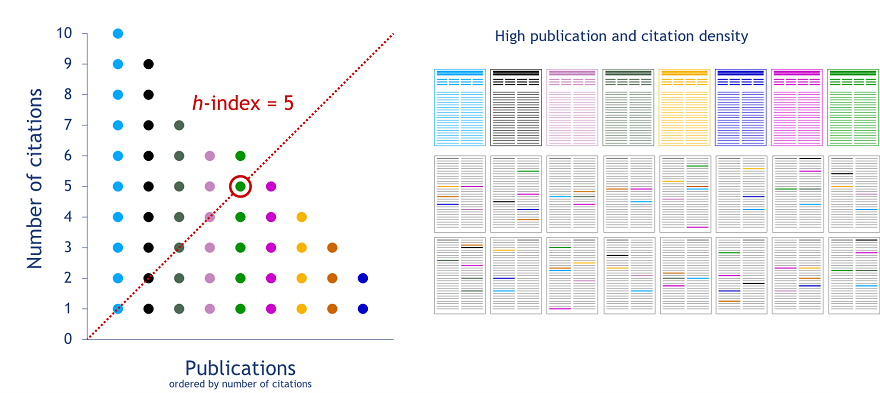
Figure 6. Calculating the h-index for a researcher active in a field with a high publication and citation density.
Three problems of the h-index
The application of the h-index in research evaluation requires a critical assessment as well. Three problematic cases can be identified in particular (Figure 7). The first one, in which the h-index facilitates unfair comparisons of researchers, has already been discussed.
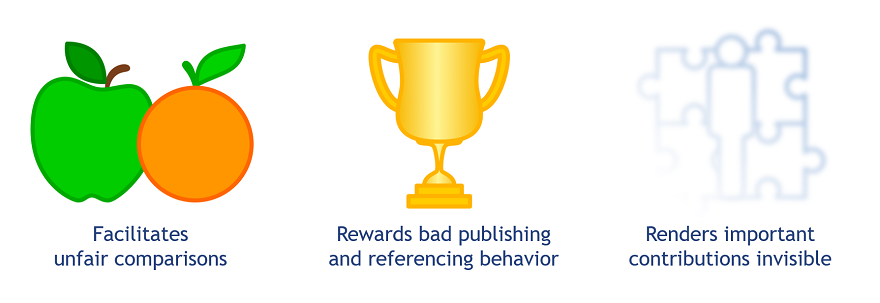
Figure 7. Three problems of the h-index
The h-index favors researchers who have been active for a longer period of time. It also favors researchers from fields with a higher publication and citation density (Figure 8).
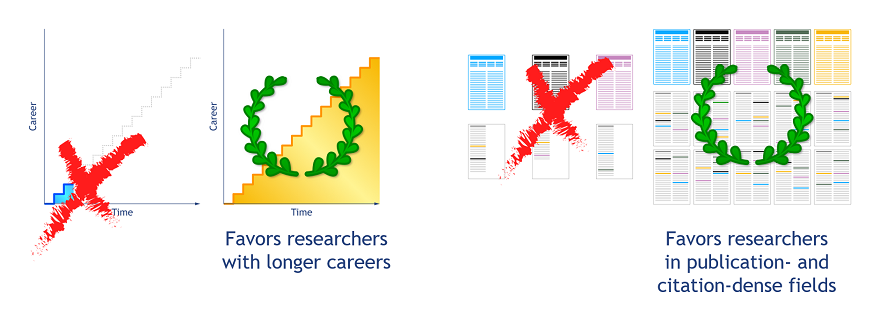
Figure 8. Problem 1: Unfair comparisons.
Another problem of the h-index is that merely publishing a lot becomes a ‘virtue’ in its own right. This means that researchers benefit from placing their name on as many publications as possible. This may lead to undesirable authorship behavior (Figure 9). Likewise, the strong emphasis of the h-index on citations may cause questionable citation practices.

Figure 9. Problem 2: Bad publishing and referencing behavior.
There is yet another issue. By placing so much emphasis on publication output, the h-index narrows research evaluation down to just one type of academic activity. This runs counter to efforts towards a more responsible evaluation system that accounts for other types of academic activity as well: Leadership, vision, collaboration, teaching, clinical skills, or contributions to a research group or an institution (Figure 10).

Figure 10. Problem 3: Invisibility of other academic activities.
Relying on just a single indicator is shortsighted and is likely to have considerable narrowing effects. Topical diversity may suffer since, as shown above, some fields of science are favored over others. Moreover, a healthy research system requires diverse types of talents and leaders, which means that researchers need to be evaluated in a way that does justice to the broad diversity in academic activities, rather than only on the basis of measures of publication output and citation impact.
Halt the h-index and apply alternative approaches for evaluating researchers
How then do we “halt the h-index”? We would like to emphasize a threefold approach when it comes to evaluating academics (Figure 11). The starting point is a qualitative assessment by one’s peers and colleagues. Adding to that, indicators applied in the assessment should be both transparent and flexible. Transparency means that the calculation of an indicator is clearly documented and that the data underlying an indicator are disclosed and made accessible. Thus, “black box” indicators are not acceptable. Regarding flexibility, the assessment should not apply a ‘one-size-fits-all’ approach. Instead, it should adapt to the type of work done by a researcher and the specific context of the organization or the scientific field in which the researcher is active. Lastly, we believe that written justifications, e.g. narratives or personal statements, should become an important component in evaluations, including in the context of promotions or applications for grants. Such statements could for instance highlight the main accomplishments of researchers and their future plans.
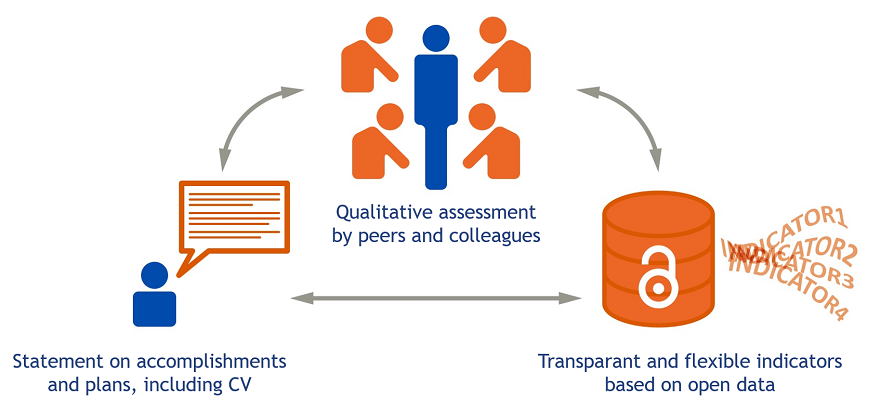
Figure 11. Evaluating academics in a responsible way.
In conclusion, evaluation of individual researchers should be seen as a qualitative process carried out by peers and colleagues. This process can be supported by quantitative indicators and qualitative forms of information, which together cover the various activities and roles of researchers. The use of a single unrepresentative, and in many cases even unfair, indicator based on publication and citation counts is not acceptable.
This conclusion very much aligns with calls for broader approaches towards recognition and rewards in academia, and was also specified in the Leiden Manifesto:
“Reading and judging a researcher's work is much more appropriate than relying on one number. Even when comparing large numbers of researchers, an approach that considers more information about an individual's expertise, experience, activities and influence is best.” (Principle 7 in the Leiden Manifesto)
What remains to be done? Take a look at the infographic and feel free to share and use it! All the visuals used in this blog post combined in one infographic, ready for download and shared under a CC-BY license, can be found on Zenodo.
Acknowledgements
We would like to thank Robert van Sluis, the designer who produced the images shown in this blog post and the final infographic.
Many thanks also to Jonathan Dudek and Zohreh Zahedi for all their help in preparing this blog post.
Photo by Nick Wright on Unsplash


No comments:
Post a Comment