In the past academics and researchers have
had relatively few tools at hand for finding out which bits of their
work are appreciated and used by other academics. There are well-known,
first generation, proprietary citations tracking systems (like ISI Web
of Science and Scopus) that cover only or chiefly well-established
journals with long time-lags. In the digital-era there are also newer
Internet-based systems drawing extensively on Google which now offer a
much broader and more responsive picture of who is citing or using whom
in academia. Both types of systems have pros and cons that we will
discuss in detail, and we will give step-by-step guidance on how
academics can use the systems to look at their own work.
Our best advice to researchers wanting to
find out how their work is being used by other academics is to use a
combination of the three best tools, which are:
find out how their work is being used by other academics is to use a
combination of the three best tools, which are:
- Harzing’s ‘Publish or Perish’ (HPoP) software, which is a
tweaked version of Google Scholar that delivers rapid feedback and
covers far more sources (and somewhat more diverse sources) than
anything else; - ISI Web of Science, which is most useful for senior
academics with a slate of published work already in high impact
journals, and for academics in the physical sciences; and - Google Book Search and Google Scholar for people working in disciplines where books and other non-journal academic outputs are important.
In the main body of this chapter we review
these three systems and quite a few alternatives in depth, and explain
how they work, what each of them is good for, their limitations, and how
to get the best possible results from each of them. Armed with our
advice notes we suggest that readers try out these systems and see which
ones seem to work best for their discipline and for tracking their
particular type of research.
We begin with a small but key digression
on how to maximise finding an academic’s name in a search engine so that
her citations can be more easily tracked. Next we consider the older
citation tracking systems that focus only on (some) journal articles. In
section three we look at the new Internet-based systems.
on how to maximise finding an academic’s name in a search engine so that
her citations can be more easily tracked. Next we consider the older
citation tracking systems that focus only on (some) journal articles. In
section three we look at the new Internet-based systems.
If an academic has a distinctive author
name (with an uncommon surname and plenty of initials to identify her
uniquely) then it will easier to find out how many other authors are
citing her research. However, if an author has an indistinct name (like
Smith, Jones, Brown, Li, Dupont, etc. and only one initial), it will
take longer to obtain the same accurate information. It may not be
possible to efficiently use some of the best citation systems at all,
such as Harzing’s Publish or Perish (HPoP), and an academic may have to
piece together citations for each of their publications using the titles
to exclude references to many namesakes. A key implication arise here
for new researchers just starting out on academic career (or a mentor
advising a new researcher). She must choose her author name with great
care, using the full first name and adding her second name or initial if
applicable. Academics should keep in mind that from now on (for the
rest of their career) people will be looking for their work in a
global-sized haystack of competing information.
In Britain and Europe generally there is a
huge extra problem to citation tracking arising from the restrictive
and old-fashioned practices of journal style sheets. Coming from mostly
small countries it is still common to find that most European social
science journals include only the first initials of authors in footnotes
or reference lists, so that they do not give authors’ first names in
full, nor include their second or subsequent initials. Since academic
knowledge is now organised on a global scale this is very bad practice.
In the US, where there are now over 300 million people, the demands of
finding people in a larger society have generally meant that much better
author details are included. This is a pattern that European academics
and journal editors should urgently start to copy.
ISI completely ignores a vast majority of publications in the social sciences and humanities. Anne-Will Harzing (2010)
There are some well-established and
proprietary systems for tracking citations, also known as bibliometric
systems. Compiled by hand and run on mainframe computers, they started
as far back as the 1970s, and the best-known now is the ISI Web of
Knowledge (which has a Social Science Citation Index). Its main rival is
the less well known Scopus. Since these mainframe systems went online
they have become a lot more accessible and somewhat easier to use. Most
academics, post-docs and PhD students should now be able to access one
of them from their offices or home computers via their university
library. (Few libraries will pay for both of them, because their
subscriptions are expensive).
The companies that produce these systems
(Thompson for ISI and Elsevier for Scopus) rightly stress that they are
well-established and well-founded on decades of experience. The systems
give accurate citation counts (without duplications or phantom
citations) because they are human-edited systems – one reason why they
are also expensive to produce and hence are charged for. Above all they
emphasise that the carefully guarded portals of the ISI and Scopus only
include academically verified journals and exclude irrelevant or
non-standard sources. However, there are conflicts of interest in Scopus
being run by a company that is itself a major global journal publisher.
Both databases also have a strong vested interest in running their
operations in a restrictive way, to protect their costly proprietary
model.
University hierarchs and government
research boards love the solid, IBM-era technology of these systems, and
view their costliness as a sign of quality. In addition, there is a
whole sub-community of scholars and consultants who have grown up to
analyse scientific referencing, especially in the physical sciences.
Practitioners in this sub-field of library science have invested a lot
of intellectual capital in learning how to use these large systems.
Because it requires years of apprenticeship to extract meaningful data
from ISI and Scopus, most bibliometrics experts favour a strategy that
presents their data as comprehensive of the best journals. This has
hindered the development and recognition of newer internet-based systems
and approaches.
Conventional citation systems like ISI and
Scopus have some severe limitations that need to be kept in
mind-especially by social scientists and academics in the humanities –
because these systems cover only a limited number of journals, and no or
few books. In addition, the indexing criteria for journals are lengthy
and heavily weighted towards journals that have already accumulated a
critical mass of citations from journals that are already in the index.
The two conventional systems have a heavy
bias in coverage towards English-language and towards older established
journals. ISI especially is heavily American- dominated. Because the US
is a large and rich society, with many more academics in most social
science fields than in Europe or any other region of the world, the
conventional systems automatically tend to deliver rankings and
statistics that are weighted heavily towards success in the US ‘market’,
compared with the rest of the world. The ISI system does not cover
references in books, (although it does cover some book reviews in
journals). The Scopus System covers Book Series. Excluding books is a
fairly small problem in the physical sciences, which explains why the
ISI systems are set up in this way. But it is an insurmountably serious
limitation across the humanities where books are the main mode of
scholarly communication and a key vehicle of disciplinary development.
The lack of book coverage poses is a serious difficulties for accurately
measuring citations within ‘softer’ social science fields where books
remain very important.
The older systems completely exclude
references in working papers or conference papers, and hence have very
long time lags. Publishing in a journal across the social sciences
generally takes a minimum of two years from submission to publication,
and often up to 3.5 years in the most competitive and technical fields
like economics. In the interim, conference papers and working papers
often provide many indications of how much work is being cited. But
neither type of outputs is included in the ISI, nor in the Scopus index.
Rather than reflecting the latest advances in academic research, these
systems tend to reflect the output component of the discipline three or
four years in the past. As a result of all these factors, ISI and
Scopus only cover a low fraction of academic journal papers in social
science published worldwide, and far less than the coverage in the
physical sciences, which can be regarded as near complete.
Figure 2.1 assesses the effects of ISI’s limited coverage of social science research. It captures the internal coverage
of the ISI databases in 2006 by showing the percentage of references
made in ISI articles that were made to journal articles already included
in the database.
of the ISI databases in 2006 by showing the percentage of references
made in ISI articles that were made to journal articles already included
in the database.
Figure 2.1: How
far the ISI Citation Indexes for 2006 include the references cited by
articles contained in the database across groups of related disciplines
far the ISI Citation Indexes for 2006 include the references cited by
articles contained in the database across groups of related disciplines
| Percentage of references cited in the ISI databaset hat are to other items included in the database | |||
|---|---|---|---|
| High (80-100%) | Medium (60-80%) | Low (40-60%) | Very low (less than 40%) |
| Molecular biology and biochemistry (90%) | Applied physics and chemistry | Mathematics (64%) | Languages and communication (32 to 40%) |
| Biological Sciences - humans (82 to 99%) | Biological sciences - animals and plants (c 75%) | Engineering (45 to 69%) | All other social sciences (24 to 36%) |
| Chemistry (88%) | Psychology and psychiatry (c.72%) | Computer sciences (43%) | Humanities and arts (11 to 27%) |
| Clinical medicine (85%) | Geosciences (62 to 74%) | Economics (43%) | |
| Physics and astronomy (84 to 86%) | Social sciences in medicine (62%) | ||
Source: Centre for Science and Technology Studies, 2007, Tables 3.1 and 3.3.
If ISI is capturing as it claims the most
important work in a field, then most of these references should be to
articles elsewhere in the ISI database. Figure 3.1 shows that ISI’s
internal coverage was indeed high in the medical and physical sciences,
for instance over 90 per cent in physics. Across other STEM disciplines
from four fifths to nearly all of the references are included. In more
applied physical science fields this proportion falls to two thirds or
three fifths, and in maths and engineering to between two and three
fifths, a level that is relatively lower. Social sciences, however, are
strongly affected by ISI’s coverage bias. With the exception of social
sciences related to medicine, coverage for the rest of social sciences
falls below 50%; for example, 43% for economics and between 24-36% for.
The humanities are the most affected with only 11-27% of internal
coverage. Most bibliometric experts acknowledge that the usefulness of
these systems declines sharply if they include fewer than three quarters
to two thirds of all journal articles world-wide.
In addition, how far does ISI’s strong
orientation towards American journals affect coverage when we come to
look at research undertaken in other countries, like the UK. A detailed
analysis was undertaken of the research submitted to the UK’s Research
Assessment Exercise for 2001 (covering publications in 1996-2000),
providing a useful external measure of coverage. It found that the ISI
database included five out of every six RAE items submitted in the
physical sciences (the STEM disciplines) , but only one in four items
for the social sciences, as Figure 2.2 demonstrates. These numbers are
very similar to the ISI internal coverage numbers above, even though
they relate to different dates. So the internal coverage estimates for
the database as a whole and the UK-specific external estimates of
coverage offer a similar picture.
Figure 2.2: The inclusiveness of the ISI database for items submitted to the UK’s Research Assessment Exercise of 2001
 Source: Centre for Science and Technology Studies, 2007
A final dimension to consider for the
social sciences concerns the trends over time – has the ISI got better
at including social science materials? Do its continuing problems
perhaps reflect chiefly its origins in the physical sciences and
initially rather restrictive approach to including journals? As the
database has expanded along with the growth of social sciences journals
and publishing, has it become any more inclusive? Figure 2.3 shows how
the detailed ISI internal coverage of the social science disciplines
changed over a decade and a half. There has indeed been a general
substantial improvement in coverage of these disciplines, but one
starting from a pretty low base. By contrast, in humanities subjects the
ISI’s inclusiveness has generally either declined or increased only
slightly. Subjects bridging from the social sciences into STEM
disciplines also show increases in internal coverage, but with smaller
percentage changes because they start from a higher initial base.
Figure 2.3: How
far the ISI Citation Indexes have improved over time in their including
the references cited by articles contained in the database across social
science and neighbouring disciplines, from 1991 to 2006
far the ISI Citation Indexes have improved over time in their including
the references cited by articles contained in the database across social
science and neighbouring disciplines, from 1991 to 2006
| ISI's internal coverage (%) in | Percentage change 1991 to 2006 | ||
|---|---|---|---|
| 2006 | 1991 | % | |
| For comparison: Life sciences | 93 | 87 | 7 |
| Psychology | 72 | 59 | 22 |
| Health sciences | 62 | 50 | 24 |
| Computer sciences | 43 | 38 | 13 |
| Economics | 43 | 35 | 23 |
| Inter-disciplinary social sciences | 40 | 33 | 21 |
| Languages and linguistics | 40 | 26 | 54 |
| Educational sciences | 36 | 27 | 33 |
| Management, Planning | 36 | 23 | 57 |
| Law, Criminology | 31 | 27 | 15 |
| Sociology, Anthropology | 34 | 22 | 55 |
| Information science, Communication science | 32 | 32 | 0 |
| History, Philosophy, Religion | 27 | 24 | 13 |
| Political science, Public administration | 24 | 17 | 41 |
| Creative arts, Culture, Music | 14 | 17 | -18 |
| Literature | 11 | 14 | -21 |
Source: The data in the first three columns are from Centre for Science and Technology Studies, 2007, Table 3.3.
Notes: ‘Internal coverage’ means the percentage of references
cited in articles in the ISI database that are to other items included
in the database. The yellow-shaded rows here are those for social
sciences, green for humanities, and blue for subjects that are primarily
physical sciences or STEM subjects.
For many years the known deficiencies of
the ISI databases in the social sciences were routinely acknowledged,
but none the less were put somewhat on one side because the data
represented one of the only sources of insight. However, in the modern
era where there are viable alternatives (indeed superior options for
most social scientists) this stance is no longer appropriate.
Bibliometricians commissioned by the UK’s Higher Education Funding
Council to help them consider the use of citations data recommended that
it was not appropriate to rely on conventional citations systems like
ISI unless the internal coverage of items approached four fifths (the
‘high’ level in Figure 3.1) (Centre for Science and Technology, 2007,
pp.xx-xx). The lower that coverage gets in a field, the less useful ISI
ratings could be for assessing scholarly performance. They recommended
that in disciplines where less than 50 per cent of references are being
included in ISI, citations analysis could not contribute reliable
information to a research assessment process.
Bearing in mind ISI’s
limited coverage and geographical bias, academics should interpret ISI
citation data with some degree of caution. In the social sciences ISI
does not in any sense provide a more accurate insight into the overall
and global impacts of academic work than newer internet-based systems.
It can offer, however, a somewhat better picture of academic impact for
those disciplines which tend to focus on high-prestige American-based
journal articles. As the US is still normally rated as the first or
second most influential country in the world across all social science
disciplines, this is an important consideration.
Box 2a explains how to access ISI and the
somewhat complicated processes that are normally necessary to extract a
record from it of how your work has been cited:
somewhat complicated processes that are normally necessary to extract a
record from it of how your work has been cited:
Box 2a: How to use the ISI Web of Science
Gaining access will usually
require going to your library’s website and following a link to the
online version of ISI that you can operate from your desktop in your
office or home office. Once you are logged on:
require going to your library’s website and following a link to the
online version of ISI that you can operate from your desktop in your
office or home office. Once you are logged on:
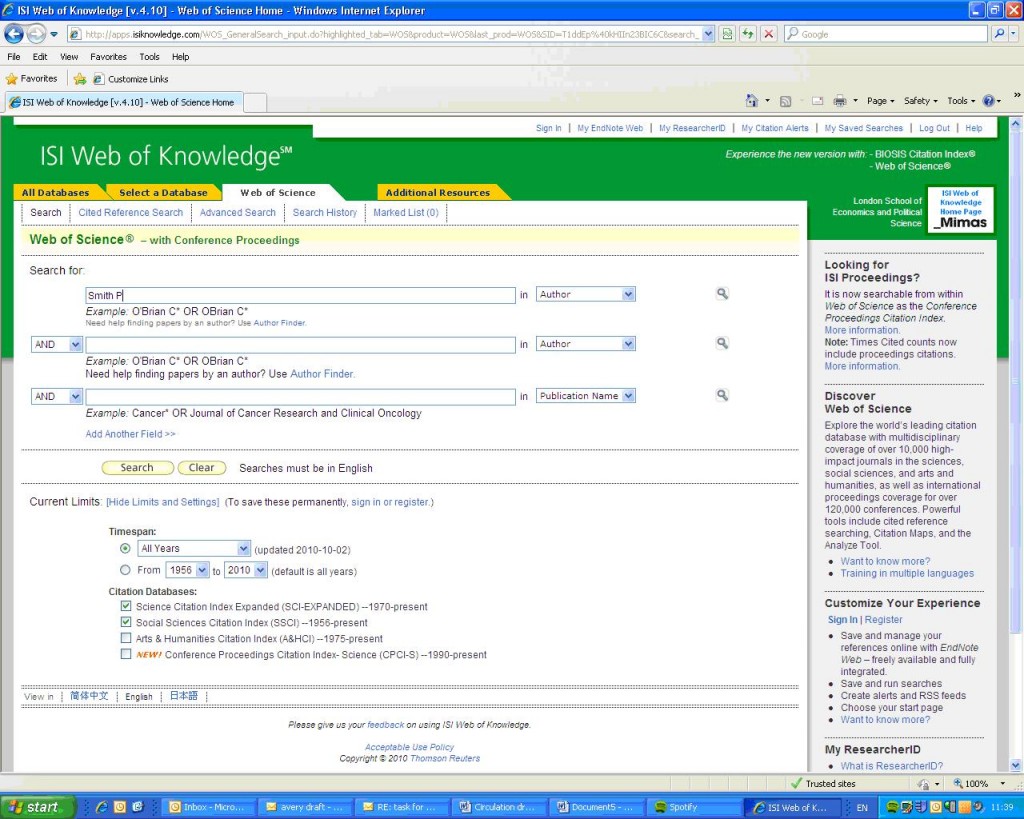
Step 1: Click the button to access the Web of
Knowledge. First use the “Select A Database” tab on the top right of the
screen and click on Web of Science. One of the most confusing aspects
of the ISI website is its proliferation of differently named databases
(all sitting on different mainframes). These names obviously mean a lot
to ISI and bibliometrics experts but they are just confusing ‘chaff’ for
normal users. You can choose to look across four citation indexes or
only choose the ones you want.
Step 2: Input the author
name you are searching for, your own or someone else’s. It is important
to do it in the restrictive (old-fashioned) format suggested by the
software. For example, if your name is ‘Peter Smith’, you will have to
enter ‘Smith P’.
name you are searching for, your own or someone else’s. It is important
to do it in the restrictive (old-fashioned) format suggested by the
software. For example, if your name is ‘Peter Smith’, you will have to
enter ‘Smith P’.
Step 3: The outputs from the
software will include each article name, journal title, volume, issue,
pages, publishing year and times cited. The most important parameter to
understand the academic impact of a researcher is the times each piece
of work is cited.To read, store and analyse the data in a more
convenient program like Excel, and to ‘clean’ it of misleading materials
and statistics, do the following
Step 4: Scroll to the bottom of the page and under Step 1 of “Output Records” select “All records on page”.
Step 5: Under Step 2 of “Output Records” deselect “plus Abstract”.
Step 6: Under Step 3 of “Output
Records” in “Save to other reference software” pick “save to Tab
delimited (win)” (or Mac if you have a Mac).
Records” in “Save to other reference software” pick “save to Tab
delimited (win)” (or Mac if you have a Mac).
Step 7: A Notepad file will be
created that you can either open immediately or save onto your desktop.
With two or more screens of data you need to past each screen into
Notepad in sequence and then save it.
created that you can either open immediately or save onto your desktop.
With two or more screens of data you need to past each screen into
Notepad in sequence and then save it.
Step 8: If you now open the
Notepad file and highlight and copy its full contents you can then just
paste them directly into Excel – the data and text will come into Excel
fully formatted.
Notepad file and highlight and copy its full contents you can then just
paste them directly into Excel – the data and text will come into Excel
fully formatted.
Step 9: Alternatively you can
import your saved Notepad file into Excel. You will be prompted to
complete three steps to import the data
import your saved Notepad file into Excel. You will be prompted to
complete three steps to import the data
(a) Select “delimited”
(b) Select “Tab”
(c) Just click on FINISH
(b) Select “Tab”
(c) Just click on FINISH
Step 10: You could archive the
whole resulting file and then copy the records to a new worksheet where
you can construct a summary tile. Delete any columns that are of no
interest to you. Normally it will be enough to retain the publication
name, authors, publication year, and times cited.
whole resulting file and then copy the records to a new worksheet where
you can construct a summary tile. Delete any columns that are of no
interest to you. Normally it will be enough to retain the publication
name, authors, publication year, and times cited.
Step 11: If you have written a lot
of book reviews in journals they will be included as items in the ISI
lists. But such single reviews are almost never cited by anyone. Hence
they will always act to depress your ‘times cited’ average. To get rid
of them, and get a better picture, sort the ISI entries in Excel in
descending order of times cited, so as to group all the zero cited items
together at the end of the list. Copy the sorted full data to a new
worksheet in the same file, and then delete the book reviews from the
end to give a new listing of just genuine journal articles.
ISI can be a helpful system for expanding
normal literature review searches. However, it doesn’t provide the very
helpful ‘snippet-view’ materials that Google Scholar does, which can be
very helpful in ascertaining what a paper is about if it has an obscure
title, and which are more helpful for checking through the backlist
works of particular authors. But ISI does provide a relatively useful
means of checking for key terms in article titles. It has a good date
record and hence is an effective way of surfacing some of the main
journal articles with keywords in their titles in say the last 5 or 10
years, often the most relevant search periods.
Google has been the prime force in the
development of article-finding, book-finding and citations-tracking
systems free over the Internet, having ambitiously declared its mission
to ‘to organise the world’s information.’ Less than a decade after its
founding, the company’s twin academic research engines Google Scholar (for journal articles and other academic papers) and Google Books now dominate the university sector.
There are other similar internet-based systems. The nearest counterpart to Google Scholar is the little-known Scirus
system from Elsevier, a free-to-use counterpart to their Scopus system
which draws more widely on current working papers and conference papers.
It operates similarly to Scholar and is worth checking as an additional
source. In the US there are some other Scholar competitor sites, but
they all rely on academics registering and voluntarily uploading
materials. As many academics are unlikely to do this, the coverage of
these sites (like CiteSeerX and getCITED) is now far too restricted and
non-comprehensive to be very useful.
The current dominance of automatic search
systems like Google Scholar (also an approach used by Scirus) derives
from the fact that they voraciously and automatically record all citations. In particular they include:
systems like Google Scholar (also an approach used by Scirus) derives
from the fact that they voraciously and automatically record all citations. In particular they include:
- all ‘black’ literature in journal articles or books that has been definitively and formally published, plus
- less conventional ‘grey’ literature, such as working papers,
conference papers, seminar discussions or teaching materials that has
been issued in a less formal or definitive form – often, of course,
including versions of material that is later formally published.
This inclusiveness makes Google Scholar
far more up-to-date in its picture of academic debates and controversies
in each discipline, especially so in fields like computer science and
IT studies where the pace of change in technologies and social uses of
IT is very rapid. Scholar also gives users much more immediate
information about the work being found, and it often gives full-text
access to it if the material is not in a published book or placed behind
a journal pay wall.
The dominance of automatic systems has
been strengthened (and the obsolescing of American voluntary
article-aggregator sites has been speeded up) by the growth of online
research depositories in most serious universities in the advanced
industrial countries. These university archives now host copies of their
professors’ and lecturers’ works that previously were accessible only
with great difficulty (by going to each individual author’s personal
website) or behind journal pay walls. University online depositories
also often contain conference and working papers that have not yet been
formally published in journals, which Scholar and Scirus can both access
and provide immediate full text access to.
Another useful development for Scholar and
Scirus has been the development of some important multi-institutional
sources hosting key research in pre-journal forms for free download. In
the physical sciences newsletters and research feeds now often sustain a
vigorous window into professional culture and current developments. In
the social sciences these networks are somewhat less developed, but
research paper depositories are big news. Two of the most important are
the multi-field Social Science Research Network (SSRN) and in American
economics the National Bureau for Economic Research (NBER),. But there
are many others.
For assessing citations in journal
articles, papers and related materials, at first sight it seems clear
that Scholar and Scirus should be the most useful search tools. However,
there are also four significant problems.
articles, papers and related materials, at first sight it seems clear
that Scholar and Scirus should be the most useful search tools. However,
there are also four significant problems.
1) Both the Scholar and Scirus systems
clearly access a range of mainly academic sources, but unlike ISI and
Scopus neither company provides any full specification of exactly which
sources they use. Scholar clearly searches many conventional academic
index systems, as well as journals’ and publishers’ websites, conference
proceedings, university sites and depositories and other web-accessible
materials in academic contexts. But Google provides almost no
information on exactly how this is done. This non-disclosure creates a
big problem for government or professional bodies, and feeds their
resolution not to take what Google says on trust.
2) For commercial reasons Google and
Scirus are both equally secretive about the algorithms that they use to
sort and search, in particular to discount duplicate entries for the
same material, and how they count the remaining citations (after
duplicates are removed). This is a highly sensitive subject and adds
another barrier. However, the companies also argue that only by keeping
their algorithms secret can they effectively counter spam, which is a
growing and huge problem. Clearly if the ranking of sites could be
distorted by spammers, the usefulness of Scholar or alternatives would
be completely devalued.
3) Critics argue that because Scholar and
Scirus are automated systems they sweep up together lots of different
academic sources, some major journal articles, key professional
conferences or major university e-depositories, but others quite likely
of questionable academic status and provenance. So citations become
blurred and over-inclusive, with far more marked variations in the
‘academic value’ or ‘research’ status of different citations than occur
within the walled gardens of the ISI database.
4) Another problem with these systems is
that they cannot recognise duplicated outputs, for example, a paper that
is available both on a standard journal website and on the author’s
personal website. This has implications for accurately counting the
number of outputs and citations.
that they cannot recognise duplicated outputs, for example, a paper that
is available both on a standard journal website and on the author’s
personal website. This has implications for accurately counting the
number of outputs and citations.
These are indeed serious problems if the
purpose of accessing Google Scholar (or Scirus) were to rank scholars’
standing or citations to their research comparatively, or if its
rankings were used to allocate rewards like research support funding
between departments or universities. However, we have chosen to focus on
two distinct features of these systems:
- allowing individual academics and researchers, or teams and departments to track their own citations; and
- expanding literature searches of other authors’ or researchers’ main works.
For both purposes, these four key problems
are still worth bearing in mind, but they are only limitations that
emphasise the need for individual judgement by the person consulting
them. Authors and research teams know their own work better than anyone
else in the world, and are therefore better able to analyse the data.
are still worth bearing in mind, but they are only limitations that
emphasise the need for individual judgement by the person consulting
them. Authors and research teams know their own work better than anyone
else in the world, and are therefore better able to analyse the data.
In addition, there are now simplified and
tweaked forms of accessing Google Scholar, of which the most important
is the ‘Public or Perish’ software available for free download from www.harzing.com/pop.htm.
This is a valuable programme that combats many of the problems of
interpreting Google Scholar outputs and allows academics to easily check
their own or others’ performance.. It presents academic outputs quickly
and computes excellent citation statistics about each author’s work,
including a overall ‘times cited’ score and times cited per year since
publication. We will continue the discussion of the more complex
versions of HPoP citation statistics in section 2.4. Box 2b explains
how to download and use the programme.
Box 2b: How to use Harzing’s ‘Publish or Perish’ software
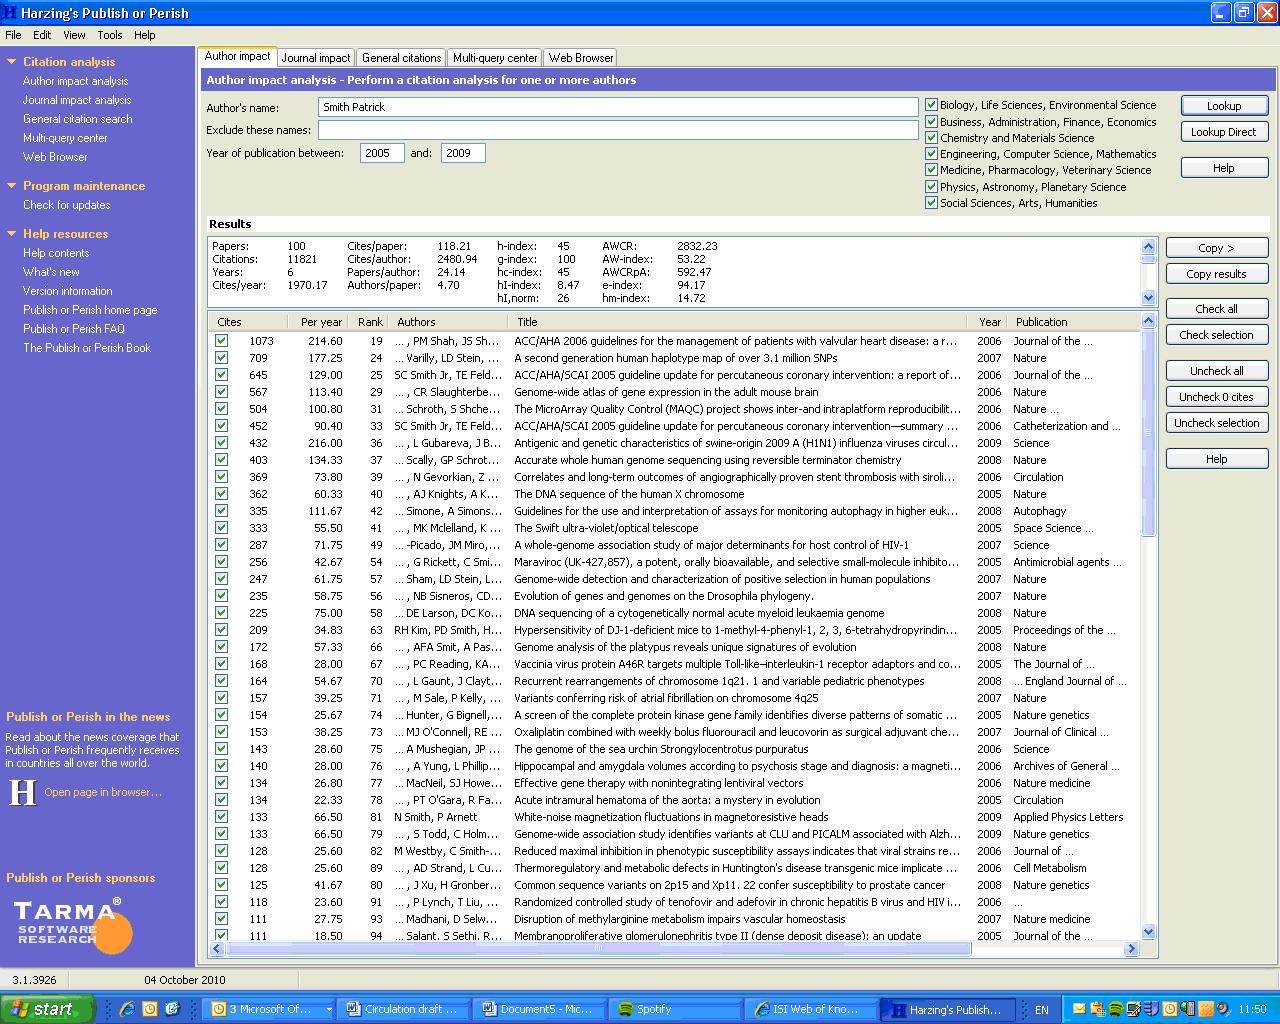
Step 1: Download the software for free from www.harzing.com
Step 2: Launch the application from your desktop.
Step 3: Choose ‘Author Impact Analysis’
Step 4: Enter the name you want as surname, firstname. (Capitalization is not necessary.)
Step 5: The statistical indicators
for that author will be displayed in the upper portion of the screen,
and a detailed list of works in the bottom panel, initially arranged in
descending order of total citations for works. You can rearrange the
order of the list of works by clicking any of the column headings here.
for that author will be displayed in the upper portion of the screen,
and a detailed list of works in the bottom panel, initially arranged in
descending order of total citations for works. You can rearrange the
order of the list of works by clicking any of the column headings here.
Step 6: Check the detailed list
for any irrelevant entries for other authors – exclude them from the
statistics by de-clicking the tick box in the leftmost column.
for any irrelevant entries for other authors – exclude them from the
statistics by de-clicking the tick box in the leftmost column.
Step7: If other authors have cited
your work in different ways (e.g. some include sub-titles and others
don’t, or get the title or name spelling wrong) there will be duplicate
entries. To eliminate (most of) these, click the ‘Title’ heading to
temporarily re-arrange items in alphabetical order of titles. Then work
through and when you find duplications, right click the duplicate item
to highlight it, and then move it to place it above the main reference
for that work: HPoP will now show these as one item. With several
duplicates, be careful to choose the most accurate one as the main
reference.
Step 8: The list of works can be
saved in Excel format (comma delimited) or copied and pasted into Word.
The Word lists initially look a bit jumbled. They can be quickly
clarified by going to the very end of each entry (giving the URL for
that work) and clicking on one space to show the URL in clickable
format. Then click return to start the next entry on a new line.
Google Books
Google Books is a system that is primarily
designed to make available a range of different online views of a
book’s contents to potential readers. Essentially Google has now run
around 10 million books through optical character readers so as to
create online images of each page. For books that are out of copyright,
Google makes available the full text for reading online, but the
material cannot be downloaded in the free use version of the programme.
The text of most out of copyright books is also fully searchable, so you
can easily find specific sentences, quotations, or words of interest
anywhere in the book. This software is so powerful and so good that many
scholars now use Google Books as an online index to find material
within books that they already have on their shelves, but which have
either no index or the normally very inadequate academic book index
system. There are also links through from Google Books to the
publisher’s website, to booksellers offering the book, or to libraries
nearby to the searchers’ location that stock it.
For books in copyright how much
information is viewable on Google Books depends on what agreement the
book’s publisher has reached with them. The most restrictive ‘no
preview’ entry just replicates the publishers’ blurb and perhaps gives
the contents pages. The next most restrictive approach is a ‘snippet
view’ that offers only a few short glimpses of the book’s content, but
still allows readers to search the full text and to find relevant
material. If you want to find out if a book covers the kind of topic you
are interested in, even in snippet view you can very quickly check far
more material in a fraction of the time that would be needed for
previous literature searches. The most expansive Google Books preview
allows you to read many full pages of the text, but normally will leave
out some key chapters or sections. However, you can usually search
across the omitted sections as well as the full text pages (helpful for
knowing how much coverage a book gives to your topic of interest). But
again you cannot download a copy of the book in the free version.
Eventually, Google Books will be available
worldwide in a commercial version that will make all copyrighted books
in its database available for download, of course in return for a fee
that will be agreed between Google, the publishers and universities.
Google will potentially have an enormous monopoly position here, in a
market that is bound to grow very strongly in size and value over the
next decade, as e-books take off. How governments in the US, Europe and
other regions of the world decide to regulate Google’s operations of
this key intermediary role will have very substantial consequences for
how academic research develops, especially in the most book-based
disciplines, such as the humanities and ‘softer’ social sciences.
Leaving these meta-issues on one side,
however, what concerns us here is the citations-counting capacity of
Google Books, and Box 2c explains how to use it.
however, what concerns us here is the citations-counting capacity of
Google Books, and Box 2c explains how to use it.
Box 2c: How to use Google Books

Step 1: Go to
http://books.google.co.uk. Alternatively go to the main Google site and
pull down the menu tab labelled ‘more’ on the left of the Google menu
bar and go to Books directly in the options menu.
http://books.google.co.uk. Alternatively go to the main Google site and
pull down the menu tab labelled ‘more’ on the left of the Google menu
bar and go to Books directly in the options menu.
Step 2: Enter the author name in
double quotes, as “Firstname Lastname” and search.You can also try it as
“Initial Lastname”. Search using the ‘Listwise’ (default) option that
shows a snippet about each item found.
double quotes, as “Firstname Lastname” and search.You can also try it as
“Initial Lastname”. Search using the ‘Listwise’ (default) option that
shows a snippet about each item found.
Step 3: When the Books search
results come back make a note of how many items are returned in the
initial count given at the top of the search list. It is generally
better to go with the version of the author name that yields most
results.
results come back make a note of how many items are returned in the
initial count given at the top of the search list. It is generally
better to go with the version of the author name that yields most
results.
Step 4: Check that the search
process is producing a close fit to the author you want and is not
cluttered up with works from many other authors. This is easy if the
author name is distinctive. If the author name is a commonplace one use
‘Advanced Search’ to exclude ‘confuser’ author names and perhaps to
require a field-specific word to be present – e.g. entering ‘politic’
for a political scientist, should capture almost all their work but
exclude non-political items.
Step 5: When you have a basically
OK listing, print the citations pages off and go through manually
excluding any remaining ‘confuser’ entries. Unless you have a very
common author name or a great deal of citations, this takes hardly any
time to do. (You may also wish to separate out and count those
references that are to the author as a book editor rather than to the
author’s own writings).
Step 6: Always click through to
the final Google Books page, and you will get a completely different
citations count, that is a fraction of the initial count. This appears
to be the count of citations excluding multiple cites. You will need to
deduct from it a number for the entries you have hand deleted.
the final Google Books page, and you will get a completely different
citations count, that is a fraction of the initial count. This appears
to be the count of citations excluding multiple cites. You will need to
deduct from it a number for the entries you have hand deleted.
Step7: If the author name is
impossible to untangle from a multitude of similar names, even in the
same field, you can try repeating the search above using their main book
or journal titles as the search items.
impossible to untangle from a multitude of similar names, even in the
same field, you can try repeating the search above using their main book
or journal titles as the search items.
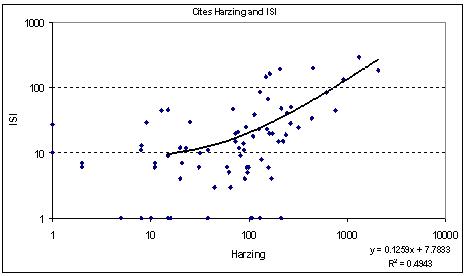
It is worth comparing how the two broad
categories of citations systems perform against each other. In general
the HPoP/Google Scholar database is much more inclusive than the ISI
one, especially in disciplines where books and book chapters are an
important means of professional communication. Figure 2.4 shows how the
ISI and HPoP indices compare. The top two parts show only the items
included in the ISI, first on a linear scale (which shows a strong
bunching of low-scoring items) and secondly on a logarithmic scale
(which helps to spread out the lower scores and shows the patterns of
data better). In every case the ISI cites score for a publication is
less than the HPoP/Google Scholar score (the point where they would be
equal being shown by the parity line).
Figure 2.4: The relationship between ISI and HPoP scores for one example academic, a senior professor in political science
Each blob represents one item’s citation scores
(a) Linear scales (coverage: ISI items only) (b) Log scales (coverage: ISI items only)
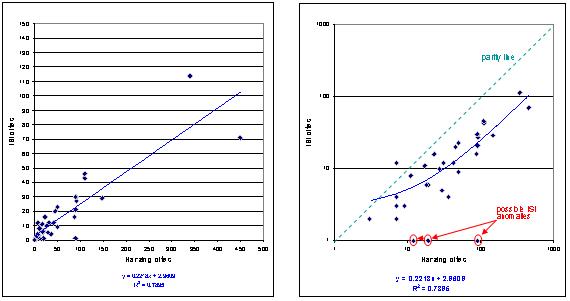
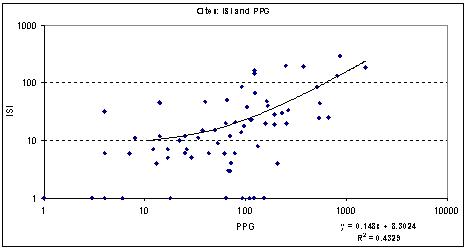
(c) ISI and HPoP scores for all items included in this author’s HPoP listings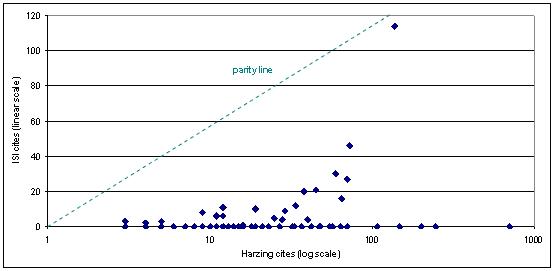
Notes: Figures 2.4a
and b include only items in the ISI database for this academic; Figure
2.4c includes all items in the person’s HPoP listing with at least three
cites. The HPoP scores have been manually cleaned to eliminate
duplicate Google Scholar entries.
and b include only items in the ISI database for this academic; Figure
2.4c includes all items in the person’s HPoP listing with at least three
cites. The HPoP scores have been manually cleaned to eliminate
duplicate Google Scholar entries.
Figure 2.4c shows the scores for all the
person’s HPoP scores. The items scoring high on HPoP but zero on the ISI
are in all cases comprised of books, book chapters and journal articles
in journals that are not indexed by ISI. Five of this author’s top 6
cited items fall into this category, and 12 of the person’s top 20 cited
pieces.
person’s HPoP scores. The items scoring high on HPoP but zero on the ISI
are in all cases comprised of books, book chapters and journal articles
in journals that are not indexed by ISI. Five of this author’s top 6
cited items fall into this category, and 12 of the person’s top 20 cited
pieces.
Of course, a single example of this kind
is only indicative, and so to get a broader picture we turn next to data
from the Impacts Project Database (IPD) described in Annex 1: Impacts Project Database.
Essentially we collated ISI and HPoP scores for all the traceable
publications of a sample of 120 academics spread across five social
science disciplines. We also carefully checked by hand all the
publications listed in HPoP/Scholar and looked at all the sources citing
them. We removed all duplicate entries, unacknowledged citations,
publishers’ publicity materials etc to produce a completely ‘cleaned’
IPD score, one that also incorporated citations in books. We aggregated
the ISI, HPoP and IPD scores for each academic concerned, and compared
them.
Figure 2.5: The inter-relationship between ISI and HPoP scores, and between ISI and IPD scores, for 100 academics in the IPD
Each mark represents one author’s aggregate citation scores. Graphs are log scaled.
(a)
(b)
(c) Correlation coefficients between the aggregate scores for authors
| ISI scores | Harzing scores | |
|---|---|---|
| Harzing scores | 0.22 (0.24) | |
| IPD scores | 0.14 (0.46) | 0.95** (0.0) |
Notes: Correlation coefficient (significance test, two-tailed).
Figure 2.5 shows a strong continuity with
the picture drawn above. Most ISI cites scores for authors are much
lower than their HPoP scores, although it is noticeable that one in 10
of the sample showed ISI scores that are higher than their HPoP score.
One in twelve of the sample were rated by ISI as having a minimal score
of 1, whereas their HPoP scores ranged from 0 to 2089 cites. (On a per
author basis there are obviously fewer instances of ISI registering zero
cites than was the case for the per item basis in Figures 2.4a, or (b)
or (c).
Figure 2.5b shows that this picture is
also strongly born out at the author level in the manually checked IPD
scores. The key reason for this is shown in Figure 2.5c, where the
HPoP/Scholar and IPD scores are shown to correlate almost perfectly (and
of course significantly). By contrast, the ISI scores correlated weakly
with the HPoP/Scholar scores for our sample, and even less well with
the carefully checked IPD scores.
So far though these are rather aggregated
analyses, at the level of an author’s whole profile of work. By pooling
data across multiple authors, and looking instead at the level of
individual items we can examine how the relationships between the ISI,
HPoP and IPD scores operate at the level of individual publications.
Figure 2.6 shows the results for all the publications of a small
sub-sample of 15 academics taken from our 120 in the pilot survey. [We
are in the process of extending the item level analysis to cover all
authors in the pilot survey, so these early findings are indicative only
at this stage – although the patterns here are so strongly marked that
we do not expect them to change much on further analysis]. We
essentially repeat here the previous analysis, but at the level of
individual publications.
Figure 2.6: The relationship
between ISI and HPoP scores, and between ISI and IPD scores, for all the
publications of a subset of 15 academics drawn from the IPD
between ISI and HPoP scores, and between ISI and IPD scores, for all the
publications of a subset of 15 academics drawn from the IPD
Each mark represents the citation scores for a single publication. Graphs are log scaled.
(a)
(b)
 (c)
(c)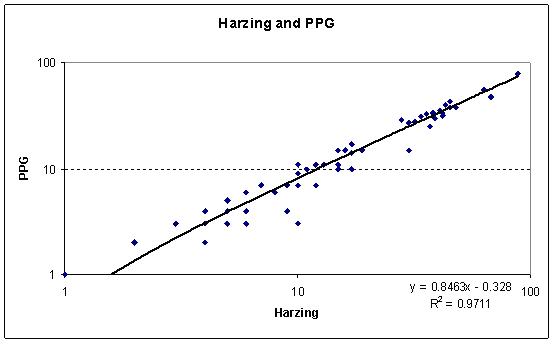
The previous patterns found are
strengthened. Figures 2.6a and 2.6b show that only around a quarter of
the score that individual social science publications get in the ISI
database can be explained in terms of HPoP
strengthened. Figures 2.6a and 2.6b show that only around a quarter of
the score that individual social science publications get in the ISI
database can be explained in terms of HPoP
/Google scholar citations, or in terms of
the manually cleaned and checked IPD scores (also including manually
checked Google Books scores). By contrast, Figure 2.6c shows that the
HPoP/Google Scholar scores for all publications included in the analysis
are very similar indeed to the checked IPD scores. Indeed the R squared
proportion of variance explained is 97 per cent, meaning that the two
indicators are clearly tapping the same phenomena. Interestingly,
although our analysis eliminated a good deal of double counting in the
HPoP/Google Scholar listings, none the less the checked IPD scores are
somewhat above the parity line here – reflecting the role of
Google Books in boosting item scores. The two indicators move closely in
step, but are not exactly the same. By contrast, the ISI citations
count for most social science publications is far less than the
HPoP/Google Scholar or IPD counts.
The implications of this analysis are
clear-cut for academics. The quickest, most reliable and most
comprehensive way of understanding how their research is being cited is
to run a HPoP/Scholar analysis of their outputs and to manually clean
the results so as to correct for problems, as discussed above. The ISI
cites scores perhaps add insight into which journal articles
are being cited in other US-orientated research articles. But in most
social science fields, and especially more book-orientated disciplines,
the ISI simply does not include enough materials to be a useful or
reliable guide to what is being found useful and cited by other members
of the profession.
Summary
|

3 Comments
Impact of Social Sciences – 2: Using citation tracking systems
August 13, 2014 at 5:55 am
August 13, 2014 at 5:55 am
distinctive is your author name? 2.3: Internet-based citation-tracking
systems 2.4: Comparing conventional and Internet citations tracking
systems Summary Introduction In the … […]
August 13, 2014 at 12:55 pm
distinctive is your author name? 2.3: Internet-based citation-tracking
systems 2.4: Comparing conventional and Internet citations tracking
systems Summary Introduction In the … […]