This
section is divided into two sub-sections. The first shows the
statistics and influence of various published bibliometrics information.
In most cases, the top 20 influential resources will be selected and
displayed. The second Sub-section, TOP 20 SETs, shows the actual various
resources related to TOP information. These results enable researchers
to have a systematic and basic understanding of the publications
released for FIS-based classifiers.
A. Publication Information
As previous research [30]
indicated, the number of publication citations was one key factor in
evaluating publication quality. This sub-section will closely combine
publication citation with various aspects of bibliometric information,
such as the number of publications per year, the number of publications
in each country, the number of authors and their trend, a statistic of
Author Keywords, the number of publication pages. These processes will
deeply explore the relationship between publications’ information and
citation.
1) Publication and Citation
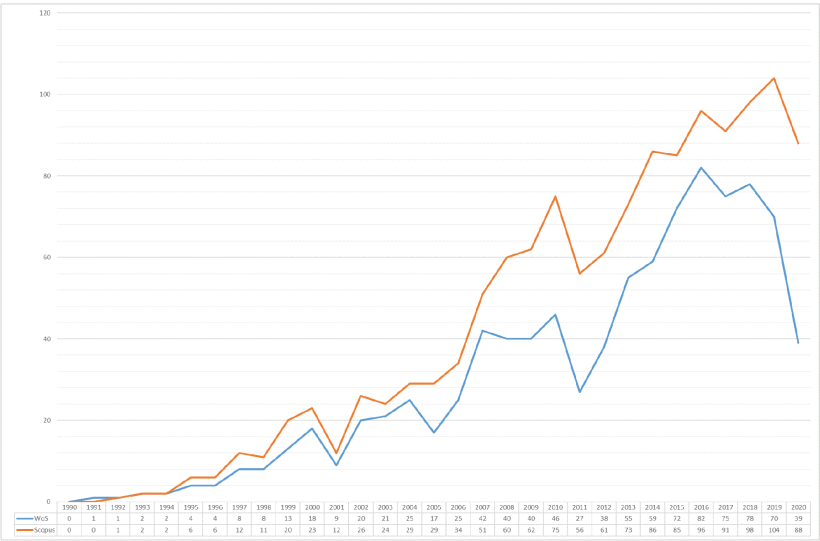
Since
the first paper was published in 1952, no more than 2 papers have been
published every year until 1995. From the beginning of 1995 to 2000,
there was the first growing trend. SCOPUS publications increased from 6
to 20, and WoS publications increased to 18. In 2000, 23 publications in
SCOPUS and 18 publications in WoS reached their first peak. Then came
the trough in 2001. Fortunately, since 2002, the number of papers has
snowballed. When the second peak occurred in 2010, this growth trend
stopped. In that year, SCOPUS published 75 publications, and WoS
published 46 publications. Although there were 56 publications of SCOPUS
and 27 publications of WoS in 2011, the trend reached its lowest point
in 2011. However, from 2011 to 2020, this trend was growing at an
alarming rate. Then, the publishing trend achieved its third high
growth. The WoS peaked in 2016 with 82 publications, and the SCOPUS
peaked in 2019 with 104 publications. Therefore, one situation is
noticed: the peaks of WoS and SCOPUS occurred in different years.
However, according to the WoS trend, the number of publications dropped
significantly after this peak. It shows, the number of FIS-based
classifiers was decreasing since 2018. The main trend is shown in Figure 3.
Although the figure illustrates a promising trend between 1990 and
2020, the part of these publications are cited. In all publications
based on FIS-based classifiers, only 690 out of 955 samples were cited,
and 1080 out of 1336 samples were cited. They are accounted for 72.25%
and 80.84% of the total dataset, respectively.
The
following is a brief overview of the trends mentioned above. Since
1952, the FIS-based classifiers’ concept has appeared in publications,
and trends indicate that the topic has become more and more popular in
the 20 years from 1998 to 2020. This release trend may be owing to more
and more practical applications in Data Mining and Intelligent Systems.
The period may have promoted discussion and research on the relationship
between computers and other fields. Although the trend contains two
valleys, the citation rate of these publications is high. Until 2020,
many new publications’ highest quality does still not exceed the highest
level after 2001. The feature is shown in Figure 4.
Besides, in recent years, the interaction between computers and humans,
artificial intelligence, and data mining attract more attention. Fuzzy
reasoning systems are usually developed as intelligent systems and
powerful data mining tools. Between 2018 and 2020, the number of
publications has dropped significantly. Since this downward trend is
evident at the end of the study, it is difficult to determine whether
the decline in the number of FIS-based classifiers is temporary or the
topic has begun to show a long-term downward trend. Usually, this
situation can be ignored owing to insufficient statistical information.
Besides,
to explore the potential impact of the citation trend, ACPY is used for
evaluation without directly calculating the citation rate trends. As
shown in Figure 4,
based on all database publications, the quality trends seem to have
been increasing between 1952 and 2020, and their dynamic trends are so
close. Please note that the dramatic situation that is the peak of ACPY
occurred during the entire development process in 2001, but the same
year’s circulation was at a low point. This situation may indicate that
our research should focus on these articles published in 2001 (9 in WoS,
12 in SCOPUS). Similar to the publishing trend, since the last year of
the record is 2020, it is not clear whether the ACPY value of FIS-based
classifier publications will continue to decline, or the topic will
start to increase. However, the SCOPUS of these trends has been
dramatically reduced. The two evaluation lines of the two databases are
also displayed in the same graph, which indicates that the future growth
trend is positive for FIS-based classifiers’ research.
2) Research Areas or Subjects
The
research topic of FIS-based classifiers involves many fields such as
Education, Mathematics, Engineering, Robotics. To better explore the
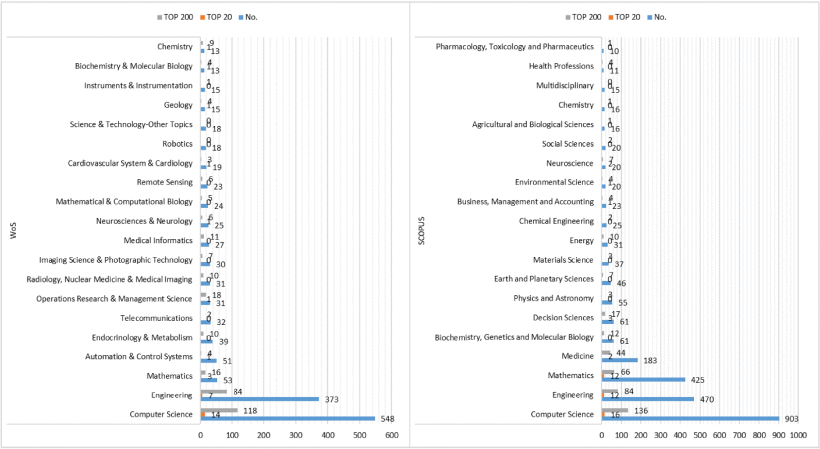
research and publication fields of FIS-based classifiers, Figure 5
collects and lists the top 20 research fields that account for most of
the entire publication. Among these fields, Computer Science,
Engineering, and Mathematics are the most studied fields in the entire
research field. According to the highest number of cited papers in each
database, more research has been conducted in these research fields.
Computer Science has the most significant number of publications, and
its top 20 publications and top 200 publications also rank first.
On the other hand, Figure 6
shows one negative result by analyzing their distribution in all
research fields. Regardless of the distribution of the top-20 or the
top-200, Mathematics, Operations Research & Management Sciences,
Neuroscience & Neurology, Geology, Biochemistry & Molecular
Biology, and Chemistry research area show better quality publications
than Computer Science in WoS. In SCOPUS database, Engineering, Decision
Sciences, Business, Management and Accounting, Environmental Science,
and Neuroscience research area show better quality than Computer
Science. The above situation seems to indicate the following
conclusions. Although the amount of research on FIS-based classifiers in
computer science is the largest among other research fields, its
research progress is still brewing. In short, the subject of computer
science research is no more mature than other fields. If analyzed from a
philosophical point of view, FIS-based classifiers still have
incredible potential because a change in quantity will lead to a change
in quality, and a change in quality will lead to a new quantity change,
namely the Law of Interchange of Quality and Quantity.
3) Types of Publications
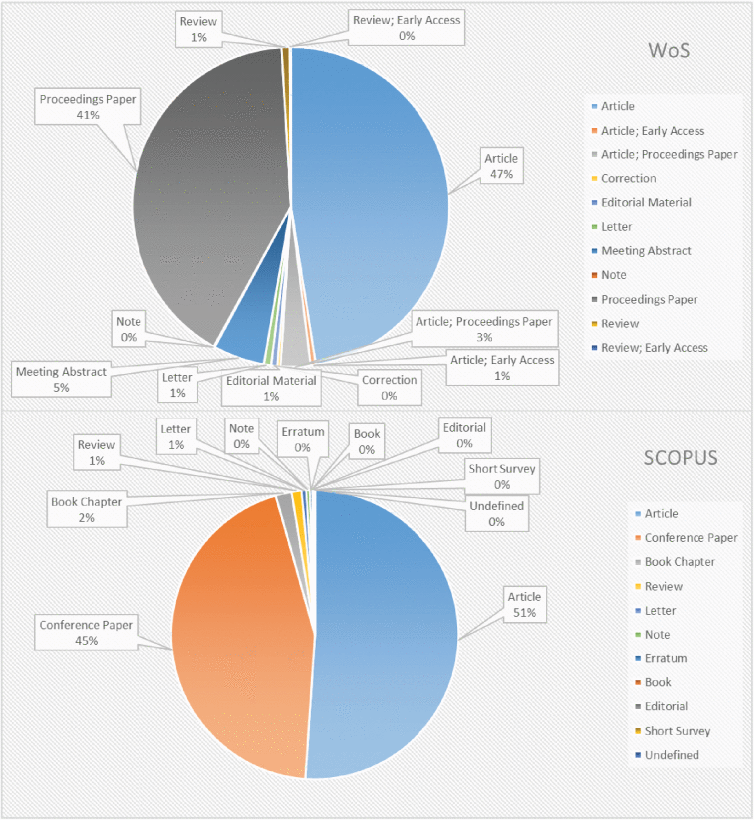
Figure 7
illustrates the distribution of the primary document types of the two
databases. Among all publication groups, articles (47%) and conference
papers (41%) are the main contributors to WoS, while SCOPUS has about
51% articles and 45% conference papers. Besides, the research found that
English is the primary language and has nothing to do with meetings,
articles, or other formats. Another auxiliary output of document types
in all publications is editorial material, reviews, conference
abstracts, news, book reviews, letters, corrections, chapters in the
book, articles about individuals, and reprints. In summary, even if
paper and articles are the most commonly used document types, others
highly dispersed document types should not be ignored because these
numerous document types may have their inherent value and meaning. If we
conduct further research, we may provide some unique insights into
research trends. The important thing is that, as shown in the drag
graph, the research topic of FIS-based classifiers has excellent
potential owing to the high distribution of conference papers.
Generally, the conference has the following advantages: the short
feedback time, contains the latest work completed so far, and can
interact with international audiences working in the same field.
Therefore, in addition to mainly focusing on articles, it is necessary
to focus on conference publications.
4) Pages of Publications
For
investigating whether one relationship existed between the number of
pages and their citations, this part is to explore by using the
information of Figure 8.
After statistical calculation, in WoS, its results show that the
maximum number of pages is 56, 1 is for minimum pages, and 9.16 is for
the average number of pages. Meanwhile, the maximum number of pages for a
full FIS-based classifier publication of SCOPUS is 226, the minimum
page is 1, and the average number of pages is 13.65.
To
further explore, APC, AAPC, and FAPC are used to determine whether
there is a positive or negative relationship between page number and
citation rate. If AAPC (Greyline in Figure 8)
is over FAPC (Yellow line), these publications can be labeled as the
positive cited rate. As the figure has shown, the number of pages of a
high-quality WoS publication is usually between 7 and 16. Limiting the
number of our publications to this range may be necessary. Besides, due
to the insufficient number of publications, some high-quality
publications with 25, 31, and 33 pages may be ignored. Meanwhile, in
SCOPUS, the issuance interval of highly cited publications is between 7
and 17 pages. Besides, the impact of a one-page publication is excellent
in SCOPUS. Of these one-page publications, conferences accounted for
66%, articles accounted for 28.71%, with errata, letters, notes, and
comments accounted for the rest. In WoS and SCOPUS, 6-page publications
with numerous publications and low citation rates are very abnormal.
These publications contain 83% meetings and 17% articles in WoS, 74%
meetings and 26% articles in SCOPUS. Perhaps the 6-page situation is one
fixed requirement from publishers, forcing researchers to limit their
published pages to 6 pages. Therefore, the research results indicate
that please make sure that the number of pages in the publication is not
6. May one thing can be ignored that is having confidence in the
quality of the publication.
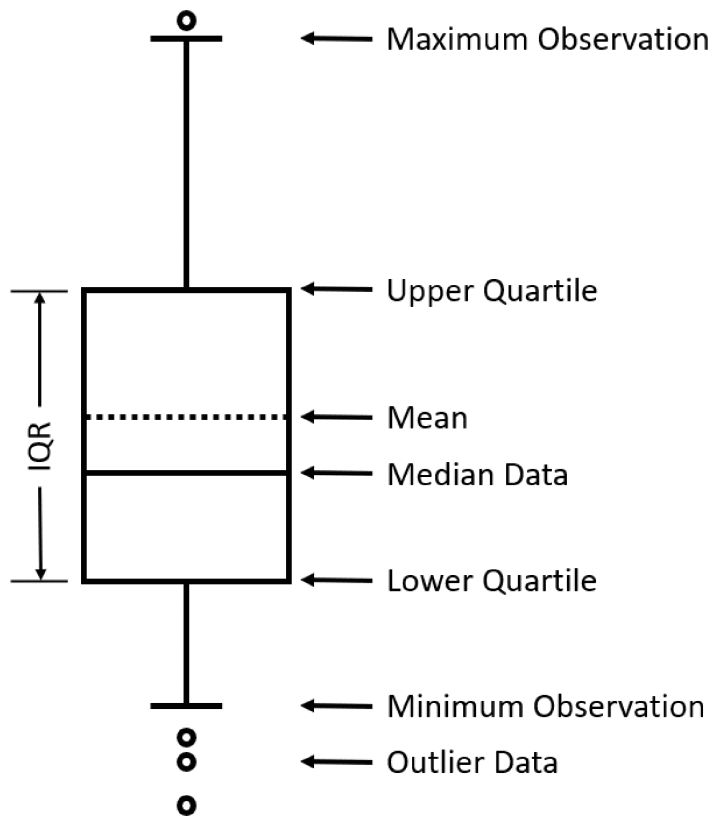
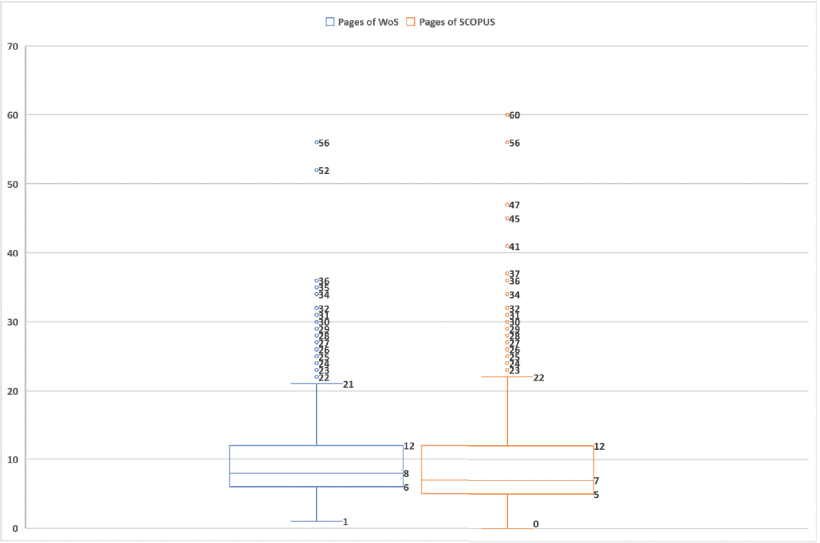
Besides, Box Plot is used for assessing one appropriate interval of the number of pages. As shown in Figure 9,
in the complete publication of SCOPUS, the lowest score, lowest
quartile, median, highest quartile, and highest score for the number of
published pages are 1, 5, 7, 12, 22. In WoS, they are 1, 6, 8, 12, and
21, respectively. Therefore, generally speaking, in the research field
of FIS-based classifiers, it is better than the pages we published are
between 6 and 12. Besides, as shown in Figure 8,
although there is no precisely significant relationship between pages
and the number of citations in FIS-based classifier publications, this
study found that the recommended number of pages for fluent publishing
and the best citation rate remained between 7 and 12.
5) Countries or Regions
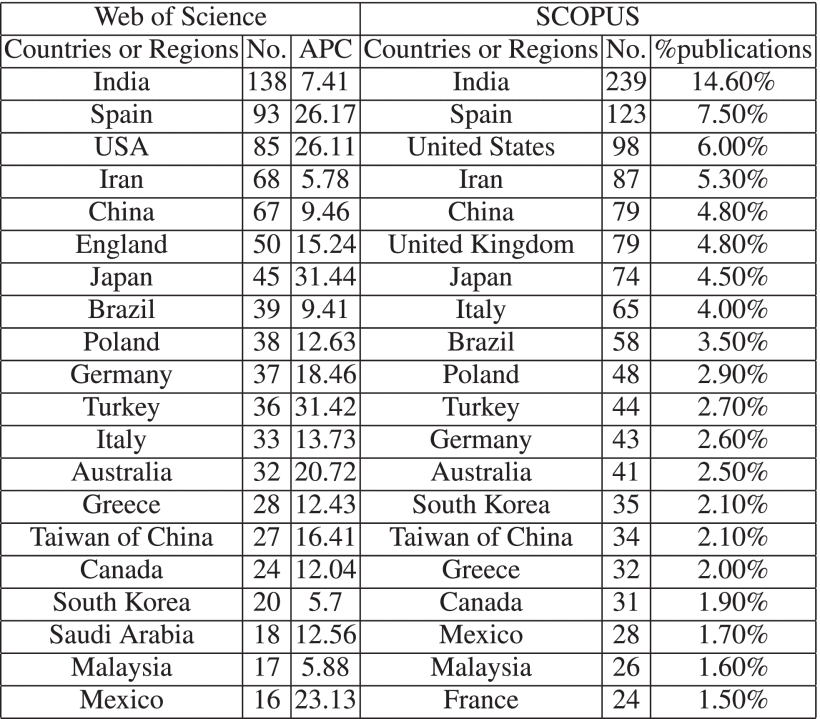
Table 2
lists the 20 most active countries/regions in the FIS-based classifier.
The sum of these countries’ publications is estimated to reach 95.71%
of WoS and 78.50% of SCOPUS in full papers. In the 20 most active
countries, India, Spain, and the USA have the most active research
status. To better understand the quality and impact of FIS-based
classifier articles in each country/region, the number of publications,
citations, and the percentage of the top 20 countries/regions with their
citations are also displayed. Relying on the two databases’ different
features, this part also summarize WoS citation information and
illustrate SCOPUS distribution. Therefore, a statistical table and a
distribution map based on the two databases are generated.
As shown in Table 2,
although Japan ranks seventh in the total number of published articles,
its APC is the highest with approximately 31.44. This situation means
that the quality of papers published in Japan is the highest in the
research domain of FIS-based classifiers. Other countries with
high-quality publications include Turkey, Spain, the United States,
Mexico. Comparing with previous countries, India has the most
publications and citations, and the APC value for all articles is only
7.41.
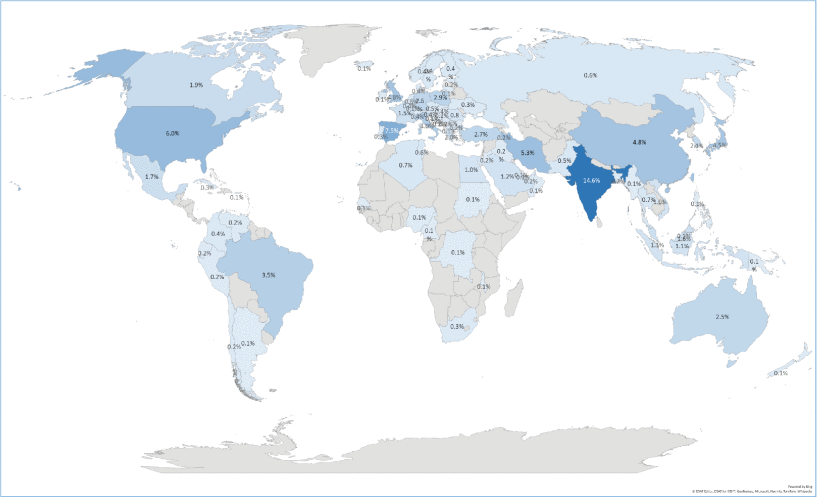
According to the following world map (Figure 10).
It is possible to determine which regions have published an analysis of
the most articles on the research topic. As the world map clearly
shows, most of the research are from Asia, North and South America, and
Europe. As one summary, this research topic (FIS-based Classifiers) is
more prevalent in Asia and North America.
6) Authors of Publications
After
surveying all authors performance in WoS and SCOPUS databases, there
are 3,463 authors in WoS, with an average value 3.63 for every paper,
and 4,554 authors in SCOPUS, with an average value 3.41 per paper. The
situation means that each paper may generally have more than three
authors in the research domain of FIS-based classifier.
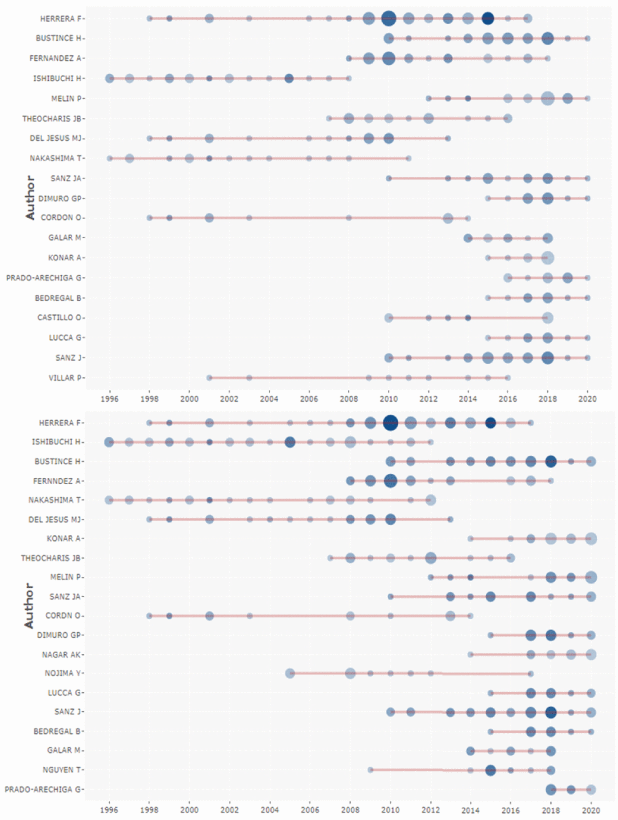
Besides, Figure 11
explores the most popular authors’ research activities, containing 19
authors of WoS and 20 authors of SCOPUS. The results indicate that,
although some authors have published many papers before, there are few
studies in recent years, such as Herrera, F. Ishibuchi, H. Nakashima, T.
Del Jesus, M.J. On the other hand, other’ researcher activities have
been active in the past five years, such as Bustince H, Konar A, Melin
P, and Sanz, JA. Therefore, if we want to understand the current popular
research topics, paying more attention to them is a valuable option to
start understanding the field of FIS-based classifiers.
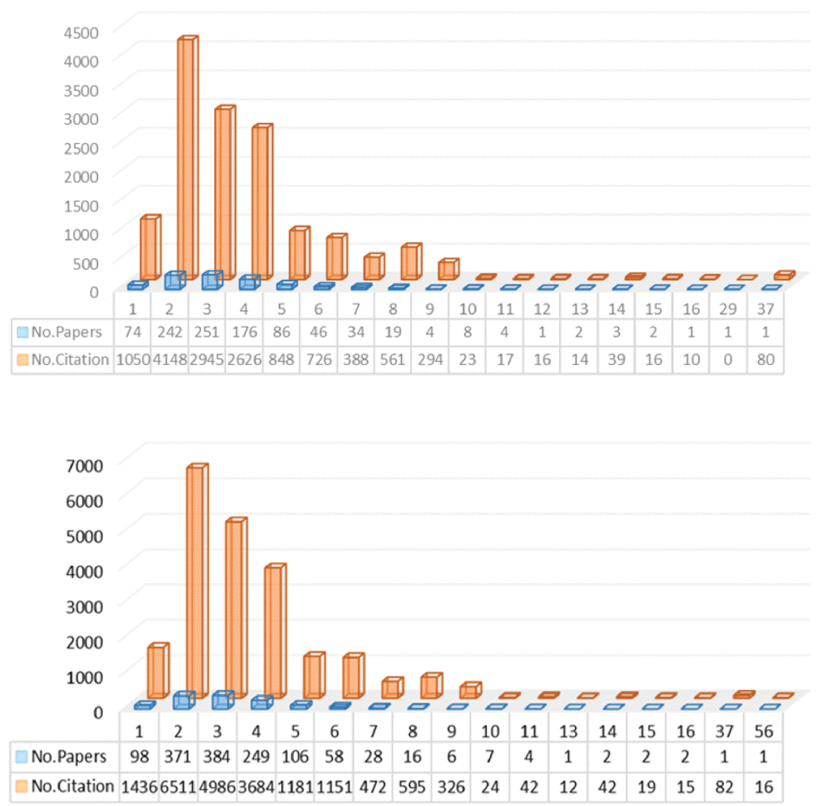
Also, to explore the relationship between authors, publications, and citations, Figure 12
was generated for this purpose based on WoS and SCOPUS. According to
their performance, their distribution is very similar, and a noticeable
feature is that most publications have 2, 3, or 4 authors, and their
publications are beautiful. Articles with one or four authors are also
cited at a high rate, but publications with five or more authors are
less likely to be cited. Besides, although papers co-authored by 37
authors have received widespread attention, this situation does not
represent an expected feature in the field of FIS-based classifier
research. These results mean that usually choosing 1 to 3 partners is
the right choice to advance our research. Please notice that some
special publication focusing on their research quality needs to ignore
the statistical guideline.
7) Author Keywords
From
a researcher’s perspective, Author Keywords are essential types of
information about research trends and have been proven to be of great
significance for monitoring scientific development [31]–[32][33].
Besides, Author Keywords usually contain the researcher’s primary
research goals and solutions. Therefore, this section will analyze
Author Keywords from three different perspectives. The first focus is to
perform statistical analysis on the Author Keywords and citations to
identify popular keywords. The second focus is to show their popularity
and quantity. The third focus is to cluster them to help researchers
expand relationship groups according to different kernel Keywords.
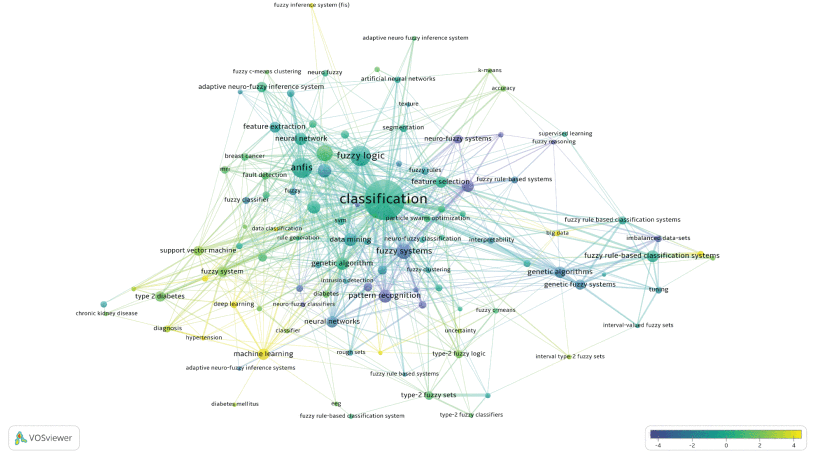
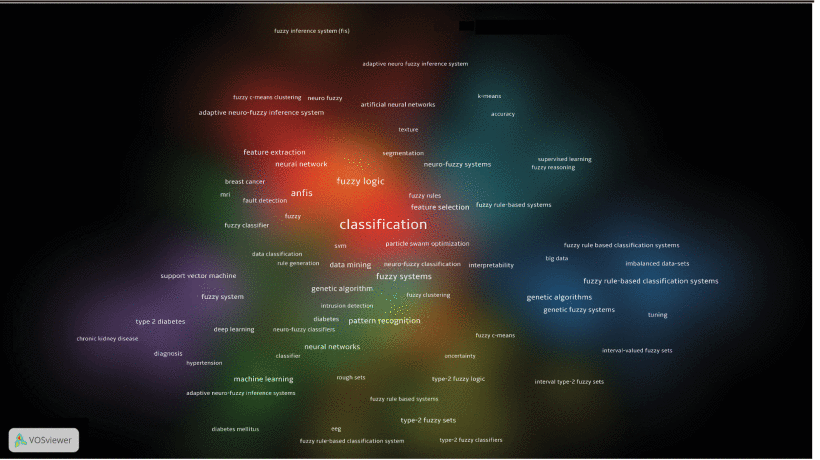
As the research continues, the Keywords will continually change over time. Therefore, Figure 13 and Figure 14
explore the hidden changes in Keywords over time and their relationship
networks. Their circle’s size indicates popularity, and a higher score
(Yellow) indicates that the Author Keyword is close to 2020. As shown in
the two figures, we can quickly obtain current Keywords to guide our
research. Meanwhile, this study primarily cluster these Keywords based
on different databases to help researchers further understand the
FIS-based classifier field and the relationship between different Author
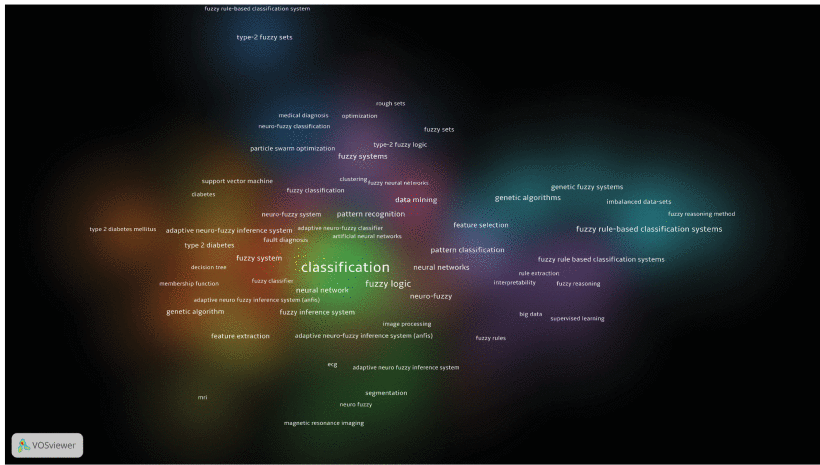
Keywords. The results are shown in Figure 15 and Figure 16.
The expression of clusters with different colors and the close
relationship between groups can help us understand the relationship
between Keywords more deeply. For example, combining Figure 13 and Figure 15,
we noticed the keyword “big data” at the bottom right of the pictures.
The following research topics surrounding big data are fuzzy rules,
fuzzy reasoning, rule extraction, supervised learning, and
interpretability when observing its cluster. These Keywords have
paramount significance in the further research of big data. However, do
not forget to do the horizontal comparative analysis after the above
longitudinal comparative analysis. For example, take “big data” go into Figure 14 and Figure 16
for exploring more relevant Keyword network. That is one critical
reason why this research does not integrate two databases’ data.
Therefore, when conducting research, we will not let keywords limit our
thinking to a certain extent.
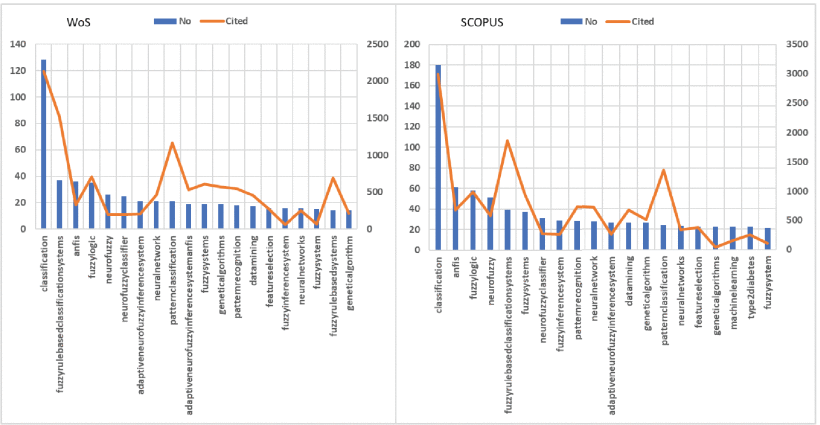
Meanwhile, Figures 17
shows the top 20 most commonly used Author Keywords’ statistical
results and their citations from the WoS and SCOPUS databases. Its lift
side (WoS) shows that the most popular keywords are classification,
fuzzy rule-based classification system, pattern classification, fuzzy
rule-based system, fuzzy logic, fuzzy system, genetic algorithm, pattern
recognition. Simultaneously, its right side shows these Author Keywords
in SCOPUS, including classification, a classification system based on
fuzzy rules, pattern classification, fuzzy logic, pattern recognition,
neural network, ANFIS, data mining, neuro-fuzzy. Besides, Figure 18
investigates the development trends of these keywords over time. Most
of them maintain a stable growth rate. The situation also shows that the
topic has potential development capabilities, especially under the
current competitive solid pressure from other classifiers.
B. Top 20 SETs
The
sub-section of Top 20 Sets consists of four parts, including the Top 20
of most-popular publications, the Top 20 most cited references in the
whole publications, the Top 20 most-popular resources, and the Top 20
popular conferences. And their statistics information will be discussed.
1) Top 20 Publications
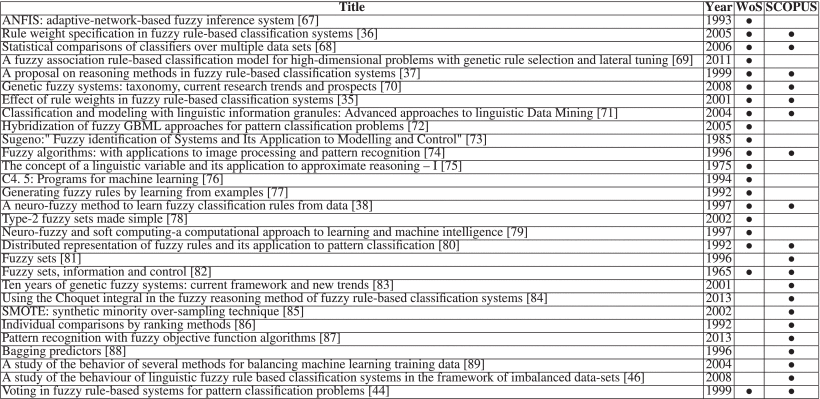
Table 3
lists the Top 20 most-cited and -popular publications in this part. The
TOP 20 most-cited publications’ citation account for more than 27.29%
of the total citations in WoS. However, their publication number only
account for 2.09% of the 955 publications, and these publications were
published between 1995 and 2015. In SCOPUS, the Top 20 most-cited
publications’ citation account for more than 21.95%. They were published
during the same period as WoS and their publication number account for
1.496% of the 1,336 publications. Besides the above, Table 3
also identifies the Top 20 most-popular (High ACPY) publications in
each database. If the average number of citations per year is high, the
publications are considered popular. Furthermore, the entire top 20
most-cited publications were published between 1995 and 2015, and the
entire top 20 most-popular publications were published between 1997 and
2019. Not surprisingly, there is much overlap between the two databases.
The percentage is 85% in the Top 20 cited, and 80% in Top 20 popular.
In
the TOP 20 table, the best quality publication research on Neuro-Fuzzy
Inference System, and two high-impact review papers focus on surveying
Type-2 Fuzzy. Besides, the table lists ten publications in the top 20
most-cited and most-popular lists simultaneously appearing in each
database. Therefore, relying on the TOP 20 table, many key research
knowledge can be easily obtained, such as the most popular FIS
structures, the popular research questions, and the practical
application of FIS-based classifiers. This is an important step in
constructing a knowledge graph of FIS-based classifiers.
2) Top 20 References
In
this part, comparing the references citation and the references number
is a significant task. Through statistical analysis and an evaluation of
the citation number, any connection between citations and reference
number can be determined. This has been illustrated in Figure 19.
According to the comparison results, there seems to be no exact
correlation between the number of references and the number of
citations. However, by comparing and evaluating their interval window’s
different sizes in each database, two significant intervals are
detected. There is a high probability that high-quality publications are
produced in the two reference intervals. WoS indicate the reference
interval is between No.38 and No.59 (Horizontal Axis), while SCOPUS
indicates its interval is between No.40 and No.59 (Horizontal Axis). The
two intervals are remarkably similar. Besides, trends in other
intervals cannot provide more valuable results.
Besides
the above finding, this part uses Box plots to explore a distribution
of the references number in complete publications. The results are shown
in Figure 20.
The number of references on this topic in FIS-based classifier
publications is usually between 13 and 35 in WoS and between 15 and 36
in SCOPUS. The interval between the two is also similar. However, if the
two reference intervals are evaluated using Figure 19,
their quality performance on producing high-quality publications cannot
be achieved within the expected high-quality interval of Figure 19.
The reason is that the reference intervals obtained from the Box Plots
and AAPC assessment are completely different. If the results are
combined with other analyses of this study, it can be proved once again
that this situation may be due to the immature research topic and too
many publications.
Most
importantly, under the above pressure, in order to promote the
development of the research topic (FIS-based Classifiers), this research
makes the proposed bibliometric statistical analysis method contain the
function of extracting TOP references. Therefore, listing the top 20
most frequently cited references in Table 4
is a necessary step for the TOP 20 SET due to these references are the
basis of the research topic. As shown in the table, most of them were
released between 1992 and 2005. Unexpectedly, the most-cited reference
also study Neuro-Fuzzy.
3) Top 20 Resources
Here,
for determining whether there is a relationship between published
journals & conferences and citation frequency, this part will
analyze resources issued by publishers based on the number of published
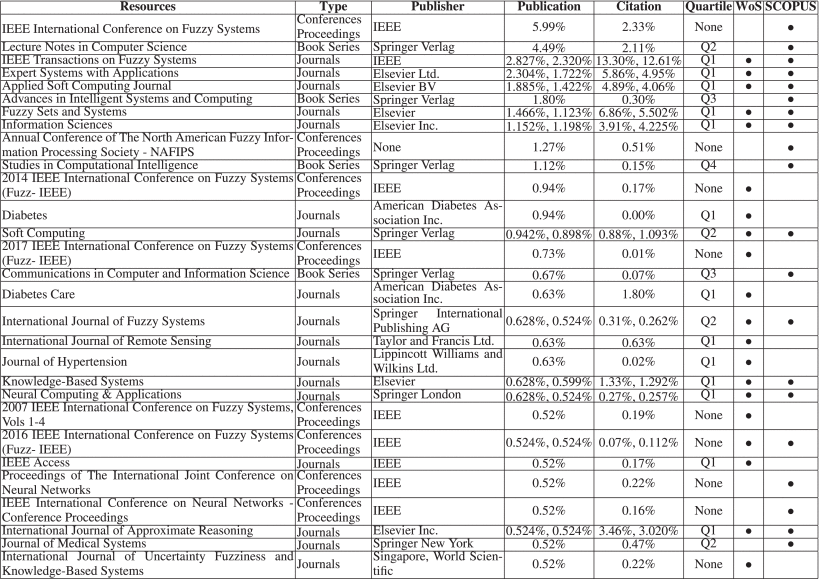
journals & conferences with the citation number. Table 5
shows that the publications of top 20 resources account for 19.581% of
all the publications and their citation account for 44.53% of the
citations’ total number. Strangely, the publications issued by Diabetes
Journal seem not to be cited by other publications, even though the
total number of publications ranks 12th with a rate of 0.94%. However,
the quality level of Diabetes belongs to the Q1. We should note that the
subject of FIS-based classifiers in Diabetes domain may take some time
to develop, or in fact these publications have great potential but have
not attracted researchers’ attention. For further assessing the entire
resources quality, the validity between publication and citation can be
evaluated by only calculating the value of (%Citation/%Publication). The
results show that the most effective level is the International Journal
of Approximate Reasoning, IEEE Transactions on Fuzzy Systems, Fuzzy
Sets and Systems, Information Science. Since the publications come from
WoS, the quality of these publishers is high. In this case, it is
necessary to analyze the data sheet SCOPUS, which contains complete
release information. These statistic information are also listed in the
same table. The top 20 publishers of SCOPUS accounted for 28.293% of all
the publications and 43.687% of the citations’ total number. Generally,
researchers can cite any of these 20 publishers to attract high
attention. In the top 20 list, there is only one Q4 publisher with
ranking 10th and 0.151% citations, namely Studies in Computational
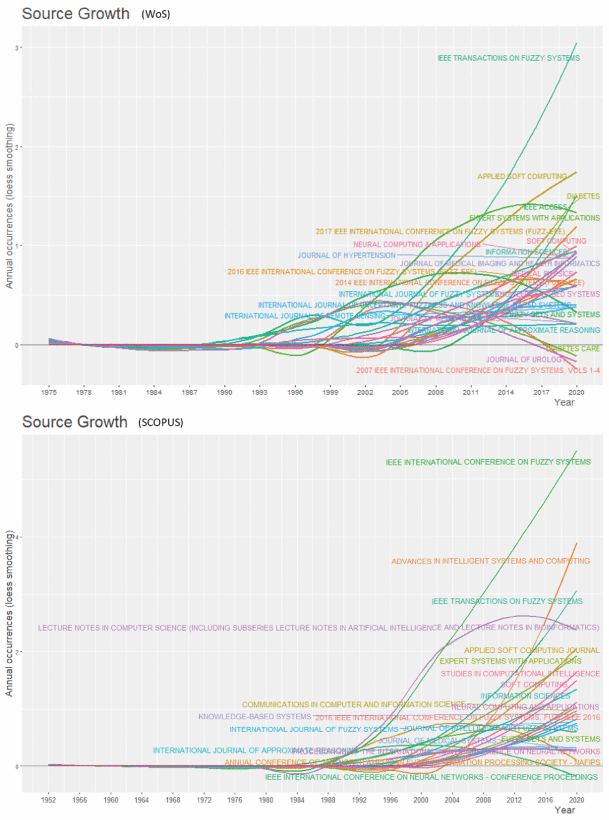
Intelligence. In addition, this research survey the dynamic tends of
these resources in Figure 21.
As one obvious result, such as IEEE Transactions on Fuzzy Systems,
Applied Soft Computing Journal, Diabetes, IEEE Access, Advances in
Intelligent Systems and Computing, IEEE International Conference on
Fuzzy Systems, these resources have an unbelievable growth trend.
Therefore, for obtaining high quality publications, we should pay more
attention to them in future research.
4) Top 20 Conferences
As
the publication type in “Type of Publications” part proves, their
number of the conference type publications and the proportion of
articles based on FIS-based classifier research are almost the same.
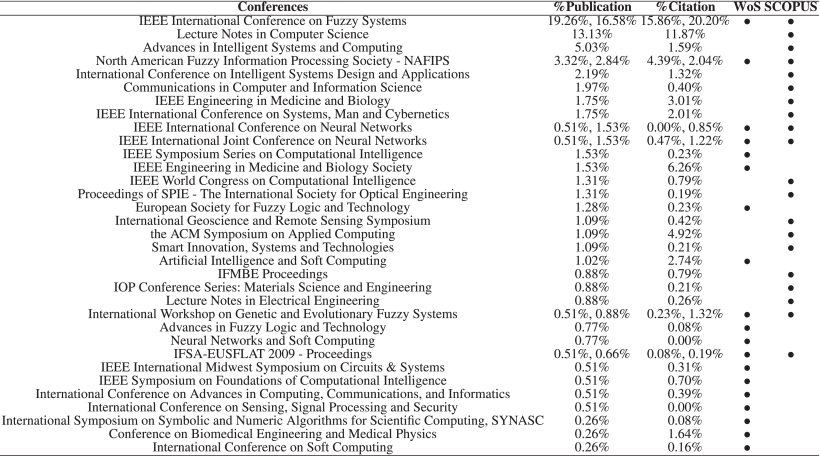
Therefore, this part uses Table 6
to list the top 20 conferences in WoS and SCOPUS. As shown that, the
sum of the top 20 citation rate of papers published at these conferences
is incredibly the highest than other types of publications, and the sum
of publications also is the highest, including 13 conferences from WoS
and 14 conferences from SCOPUS, and 6 conferences simultaneously
collected by both of databases. Meanwhile, more conference papers mean
that the research topics of FIS-based classifiers still have excellent
potential. Therefore, these conference publications are rapidly
promoting the development of the FIS-based Classifiers.