In order to improve the quality of systematic researches, various tools have been developed by well-known scientific institutes sporadically. Dr. Nader Ale Ebrahim has collected these sporadic tools under one roof in a collection named “Research Tool Box”. The toolbox contains over 720 tools so far, classified in 4 main categories: Literature-review, Writing a paper, Targeting suitable journals, as well as Enhancing visibility and impact factor.
Nowadays, the world’s scientific community has been
publishing an enormous number of papers in different scientific fields.
In such environment, it is essential to know which databases are equally
efficient and objective for literature searches. It seems that two most
extensive databases are Web of Science and Scopus. Besides searching
the literature, these two databases used to rank journals in terms of
their productivity and the total citations received to indicate the
journals impact, prestige or influence. This article attempts to provide
a comprehensive comparison of these databases to answer frequent
questions which researchers ask, such as: How Web of Science and Scopus
are different? In which aspects these two databases are similar? Or, if
the researchers are forced to choose one of them, which one should they
prefer? For answering these questions, these two databases will be
compared based on their qualitative and quantitative characteristics.
For
a long time, there were just two main citation sources that spanned
most disciplines, one provided by Web of Science and the other Scopus.
As I noted in past posts (here, here), this has changed in the last 2 years, new citation sources both proprietary such as Dimensions, and open such as OpenCitations Corpus have started to emerge.
At
the same time, I have recently became interested in the potential of
Science or bibliometric tools for aiding phd students who want to do
more sophisticated literature review.
As such, I've started to notice that the science mapping tools that are still in active development e.g. VOSViewer , Citespace or newer tools such as Citation Gecko
have started to respond to the trend of new emerging citation indexes
and started providing support of these new sources on top of the
traditional Web of Science and Scopus only.
Similarly the popular tool Publish or Perish by Anne-Wil
Harzing which began by supporting extraction of results and citations
from Google Scholar has now also grown now to support other citation
indexes beyond Scopus or Web of Science.
In
this blog post, I will talk about some of the new indexes, Science
mapping tools are starting to support, and as an aside provide a brief
overview of what such tools can do and my first thoughts on them.
As
it stands, it seems Microsoft Academic graph (due to it's size),
Crossref (due to its openness) and Dimensions (Digital Science backed)
are starting to be sources used by such tools.
A warning, I'm still trying to figure out such tools, so chances are my understanding is incomplete!
Rise of open citations and emergance of new citation indexes
Creating a new citation index isn't easy. You not only need metadata such as article , title , abstract but you need the references in each item to construct the citation index. Let me detail some of the sources that have started to emerge that can be used to contruct citation indexes.
The
open citations in Crossref are made up of metadata received from
publishers and made open for all. As I write this, roughly 60% of
articles deposited by all publishers in Crossref has open citations.
How open is the scholarly citation graph today?
Scholarly publications with #OpenCitations data have grown to 59% out of 47.6M articles with references deposited with Crossref.
Indeed, an alternative way of obtaining data and citations is to crawl webpages and PDF and parse out the details.
As
we all know perhaps the biggest source of data and citations has always
been "available" via Google Scholar, which obtains such data by
crawling , harvest and parse the data from webpages but unfortunately
with the lack of an API this data is unaccessible for bulk use.
But their tech rivals Microsoft has gone beyond this. Not only have they re-launched Microsoft Academic
their alternative to Google Scholar but also released the citation data
(no doubt obtained using similar methods as Google Scholar) dubbed Microsoft Academic Graph (MAG) as open data. As I noted in my past review of this set of data,
studies have indicated that the size of the data is truly massive
(currently it is at 200 million items) and is probably 2nd largest index
available next to Google Scholar
Beyond Crossref and MAG, other smaller sources of article metadata and citations exist and are available such as via Semantic Scholar, Wikidata/Wikicite, EuroPMC, and more.
With
so many citation sources available and open (depending on your
definition), citation indexes have started to emerge that blend such
sources , some examples include the already mentioned Dimensions (Crossref plus additional closed sources), Lens.org (Crossref, Microsoft Academic, Pubmed), Scinapse (Microsoft Academic Graph , Semantic Scholar, Springer Nature SciGraph, PubMed), Scilit, ScienceOpen etc.
VOSViewer - almost as easy as creating a word cloud
There
are two challenges to using bibliometric mapping tools. Firstly, you
need to have some basic understanding of the concepts. What's
bibliometric coupling network vs Cocitation network? What does
centrality mean? What does distances between clusters mean (if
anything).
The other challenge is usability,
most of the science mapping tools are shall we say not designed for ease
of use in mind. My guess is most of them are designed by the authors
for either own use primarily or for fellow bibliometricians and as such
as extremely powerful to use, but with correspondingly higher entry
barriers.
VOSViewer a Science mapping tools by Nees Jan van Eck and Ludo Waltman from CWTS is probably the only exception to the rule.
While it cannot solve the earlier problem, it does do well in trying to make things user friendly.
Rather then being open ended leaving the user to decide what buttons to press, at the start VOSViewer
guides you by prompting the options at each step. It also seems to
provide a lot of sensible defaults and I often could generate something
reasonable looking.
For a librarian like me with a
basic (not expert) amount of bibliometric knowledge (and a bit of
googling + manual reading helps when trying to understand terms), this
is often sufficient to quickly generate a bibliometric map in 10
minutes flat (assuming you already have the required files exported from
citation indexes).
Admittedly the more I played with these
tools, trying to understand why and how some types of networks could or
could not be created based on the source file used, my understanding of
such networks & how they were created improved.
In particular, the newer citation index Dimensions makes it almost seamless to use in Vosviewer (free version is limited to 2,500 results).
Exporting Dimension data for VOSviewer
Ways to use science mapping tools
Tools like VOSviewer
generally provide the main mapping features. Firstly one can feed it a
bunch of text and make it create a term co-occurance map. A typical use
is to feed it articles, and it will create a map of terms phrases with
words that tend to occur together appearing close to one another (or are
linked strongly to each other).
While
that can bring you some insights, the use cases I tend to look at is to
look at maps based on citation relationships which limits the number of
possible sources ie sources that include references and not just
title/author/abstract type metadata.
So
say you want to generate a map using bibliometric coupling or
cocitation of papers to look for interesting patterns. The easiest way
to do so is to search a citation index with keywords, export all the
results found (including references) into VOSviewer for visualization.
Export records in Scopus - notice "include references" is checked
Another traditional use of tools like VOSviewer is to put out all papers by one institution and study patterns within.
While
they have always provided support to the main sources including Web of
Science , Scopus and Pubmed, since Jan 2019, they support the following
sources as well
Dimensions
Crossref
Europe PMC
Semantic Scholar
OCC (Open Citation Corpus) & COCI (OpenCitations Index of Crossref open DOI-to-DOI)
Wikidata
Microsoft academic (new as of Sept 2019!)
This is an amazing array of citation sources!
Co-authorship map of my institution Singapore Management University using Microsoft Academic data
Co-occurance map of my institution Singapore Management University using Microsoft Academic data and Field of Study as unit
That
said, besides Dimensions and Microsoft Academic (which are potentially
larger than Scopus and Web of Science in terms of items covered if not
necessarily citation density), it's unclear to me how useful the other
sources are useful because they are usually a lot smaller.
I did
find one exception. I was doing visualization of all the papers authored
by researchers from my institution using Scopus. As my institution has a
heavy CS/IS component, when I used Semantic Scholar I found a richer
map generated than Scopus or Web of Science as Semantic Scholar is
strong on CS papers.
Quick summary of VOSviewer
VOSviewer is one among dozens of science mapping tools, however it is one of the easiest to use.
Sensible
defaults, a guided flow makes it such that one can generate a nice
looking map in a matter of minutes (less time downloading the files for
visualization).
For instance the map before was generated from data from Dimensions and visualized by VOSviewer
in less than 10 minutes. As this is a bibliometric coupled map, each
node is a paper from Dimensions and nodes that are near to each other
are more strongly related. By default size of node represents total
number of citations.
VOSViewer
also automatically attempts to detect clusters of papers, which each
color representing a cluster. In theory papers in each cluster is more
related to each other than to papers not in the cluster.
Bibliometric coupling of Dimensions (title and abstract) data exported with Board independence
You
can also show an alternative view with each color representing another
metric. In most cases, you would use the color as a heatmap to represent
year of publication. In some cases you may be able to see certain
clusters tend to be newer or older.
In
the example above you can see the right most papers are mostly newer
papers and these happen to be the purple cluster of papers from the
earlier chart.
One of the nicer things about VOSviewer
is that whether you are using Scopus,WOS, Dimensions, Microsoft
Academic in most cases clicking on the nodes will bring you to a
appropriate paper to learn more about the paper e.g. Publisher article
page, Scopus record etc.
This is important because when you are
new to the area all the node labels - Author (year) means nothing to you
and you often find yourself clicking a few nodes in a cluster before
you can figure out what each cluster kinda represents.
Citespace - a powerful yet difficult to use tool
On the other end of the spectrum we have CiteSpace by Chaomei Chen of Drexel University.
I
must admit when I first tried it , I couldn't even get it to run! But I
eventually was drawn back to trying it when I read about the
auto-labelling feature of Clusters.
Like VOSviewer, Citespace is able to autocluster papers, authors etc. But one of the most useful tricks in Citespace
is it is able to autolabel clusters using title/keyword/abstract
(depending on the source of data you use and the type of map you
generated), so it gives you a hint of what each cluster is about even if
you don't recognise a single paper.
For instance, the graph
below shows data generated by doing a basic search in Scopus using the
query team creativity and exporting the full record in RIS. After some
work converting the data to a suitable format, I chose to visualize the
data using co-citations, aka a document co-citation network and then
cluster.
I've hidden the labels for nodes and reduced the node to smaller sizes so the cluster labels come up more clearly.
Document Cocitation network visualized with CiteSpace from Scopus data (Team Creativity)
As
noted in the video, you can click on the buttons T, K, A to switch to
use title, keyword or abstract respectively to generate the cluser
labels. You may also change the algo used to generated cluster labels by
clicking on the buttons, LSI, LLR, MI etc.
This doesn't always work as some data sources may not have abstract etc.
In particular, I am generating a document cocitation map here. This means each
node represents a cited reference and not the indexed item from Scopus.
By default, the labels are generated using the citing items (aka the
indexed items) but by pressing on the Green CR button, you can change to
using the cited reference data itself. You will find
the CR button option doesn't work if you are using WOS data because for
some reason WOS cited references do not contain article titles (try
exporting and opening a file to see!).
The interesting side
effect of playing around with these tools is my understanding of what
fields are or are not exported from citation databases like WoS, Scopus,
Dimensions improved! Citespace
does a ton more including having the ability to detect "citation
bursts" (time windows where some articles suddenly got a lot of cites),
show evolution of cluster labels over time (Cltr-Y) etc.
Generating citation bursts list - you will need to click on the citation/frequency button first)
Top 5 articles with Citation bursts
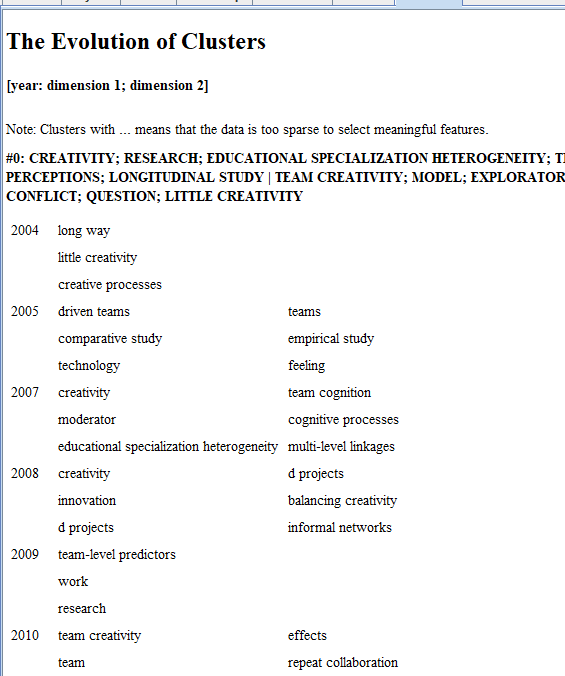
How cluster labels change over time where I selected it to show 2 labels per year.
Citespace also has various views - a lot relating to time. I skipped over this but a unique point about Citespace is that it allows you to segment your analysis in time slices. Typically one year would be one slice but you can change this.
Like Vosviewer
you can of course use color to represent time slices for example in the
image below you can see some clusters are more yellow which are newer
papers.
But you can go beyond that and "Step forward" in time using the time slider for each slice
As
you go forward or backwards in the time you can see the linkages
appearing. The above image is set to the time slice 2008-2008 and you
can see the links appear on the top part of the graph.
Incidently,
the image above also has the tree ring option turned on as you can see
some nodes are surrounded by rings of different colors , each
representing years they were cited and thickeness representing the
amount.
But perhaps a clear view is if you switch to a timeline
view (two button from right). I've also hiddent the node labels just
showing cluster labels.
Timeline
view is nice if you want to see more clearly the interactions between
each identified cluster. Coupled with the time slice feature, you can
see for example in 2018, which papers and clusters they belong to were
cocited.
This is really just scratching the surface and like VOSviewer, Citespace seems to be regularly updated.
In terms of the data sources supported for citation based visualizations, Citespace
is pretty impressive supports quite a few formats (though some of them
might just be term co-occurance maps rather than citation based?).
The ones I have tested includes WOS, Scopus,Dimensions and most recently Lens.org (see instructions).
Visualization using Lens as a source in Citespace
Citespace is really powerful but in terms of learning curve it is way higher than VOSviewer.
Part of it is because of the many options, but a big part of it is it
simply isn't as user friendly. For instance to work with Scopus you need
to go through a conversion process, while it works natively in VOSviewer.
Clicking on nodes in Citespace
to get to papers or cited references often doesn't work. Or in some
cases it does work but you won't realise it because it silently opened
up a tab in the control panel window (but doesnt switch to it). This
seems to occur quite a bit for various functions.
You
can search for papers to add as "seed papers" or upload them via Zotero
libraries and it will try to create relationships between the papers
you entered.
The key here is that Citation Gecko
is able to leverage citation links between seed papers (in yellow
below) and other papers to help highlight possible papers of interest.
For
instance it could reveal papers that were cited frequently by your seed
papers (co-citations) or conversely papers that cited your seed papers a
lot (bibliometric coupling) all with a single click.
Citation Gecko
The main difference between Citation Gecko and the other two is you can explore and expand your citation graph by adding nodes that are found (add as seed paper), while Vosviewer and Citespaceby and large are fixed maps based on what you exported from citation indexes. (though I see a SQL database option in Citespace).
Citation Gecko draws from Crossref and used to draw from Microsoft Academic.
Publish or Perish software
This
isn't quite comparible with the other tools since it doesn't do
visualizations, but I will include it here because like the other tools
it has been expanding the sources it supports. As of version 7, it
supports quite a few sources.
Besides Google Scholar, Scopus and
Web of Science, it also supports Crossref and Microsoft Academic and
support for Dimensions might be on the way.
Sources you can use in Publish or Perish
Impact of new sources on tools
It's
difficult for new citation sources to get accepted compared to the
traditional big three - Scopus, Web of Science and Scopus.
These
indexes have the advantage of being widely used, analysed and over the
years have been refined and cleaned up from feedback of thousands of
users including librarians pointing out errors. It is thus difficult for
new sources to compete as they are not as trusted.
In a way such tools benefit from network effects , the more users use it and provide feedback the better it becomes.
Digital
Science backed Dimensions is making a go at it, by partnering with
institutions and making the data open for research by bonafide
researchers to increase confidence in the data.
Lastly,
as more tools particularly well known ones like Publish or Perish,
VOSviewer start supporting these tools, this further increase the
user-base and corresponding feedback from users
As
I write this bibliometrics researchers are having a field day comparing
these new sources against the usual big 3, but as most of these new
sources are open (with exception of Dimensions), it leads to a situation
where they have to decide how to deal with "blended indexes" like
Lens.org that consist of more than one open source.
Is
there any point in comparing say Lens.org (Microsoft
Academic+Crossref+others) with Scopus/WOS when you already have compared
Microsoft Academic? After all there is reason to suspect Microsoft
Academic dominates the results in Lens.org.
For example
@CameronNevlon published a paper comparing Scopus, Web of Science and
Microsoft academic and someone asked him about including Lens.org. His
response?
We haven't done the due dilligence but in principle @lensdotorg
should be broadly the same as MSA. Now we have a way in need to look at
BASE, CORE and others (particularly regional like AURA SciELo and AJOL)
Similarly
should tool makers like VOSviewer, CiteSpace borther to support file
formats from Lens.org if they already support it's components sources
like Crossref and Microsoft Academic?
As it
stands, Microsoft Academic, Crossref and Dimensions seems to be the
"must support" sources these tools are trying to support, though things
might change.
Towards a Framework to Enable More Transparent Communication of Open Access Publishing Services and their Prices
05/09/2019
cOAlition S aims to help make the nature and prices of Open
Access publishing services more transparent, and to enable conversations
and comparisons that will build confidence amongst customers that
prices are fair and reasonable.
Wellcome – in partnership with UKRI and on behalf of cOAlition S – have appointed Information Power to lead a collaborative project with publishers, funders and universities to develop a framework for these communications.
The project will run from September through December 2019.
More information is available in the Information Power press release.
By Mario Malički, Maria Janina Sarol, and Juan Pablo Alperin
As can be seen from a series of recent publications,1-6 there is great interest surrounding preprints—scholarly manuscripts that are published ahead of peer review. “97688449“by pttgogofish is licensed under CC BY-NC-SA 2.0
And while these studies show a rise in the number of documents posted
on preprint servers, they fail to offer a clear picture on how the
growing number of preprint servers are being used, and how different
communities are engaging with preprints. That’s why ASAPbio teamed up with the Scholarly Communications Lab on a project investigating preprint uptake and use across life and other sciences.
As we will describe in this four-part blog series, we encountered
many challenges in working with preprint metadata, including lack of
documentation, missing values, and incompatible and erroneous data. We
have documented these challenges, in the hopes of helping those, who
like ourselves, would like to better understand what is happening with
preprints.
We begin this series with an analysis of the resource that was supposed to aggregate metadata of multiple preprint sources—the SHARE database—while the other three blogs will focus on the Open Science Framework (OSF) preprint servers, bioRxiv, and arXiv.
A deep dive into the Center for Open Science’s SHARE database
The Center for Open Science (COS)—the same group behind the OSF Preprint servers—partnered with the Association of Research Libraries to build the SHARE Infrastructure in
order to harvest and normalize metadata from more than 100 sources
(preprint servers). Within the 2,222,495 records contained in SHARE as
of January 2019 (full dataset is available here,
1.46 GB uncompressed, provided to us by the SHARE team), we uncovered
many discrepancies, omissions, and errors, which ultimately prevented us
in using it as a source for our planned analyses. We present or
findings for each of the major metadata fields available in SHARE:
1) Sources and records per source
We could not find information on SHARE’s website or GitHub pages
specifying to what extent records are harvested from the different sources
available in SHARE. In the records database they provided us, we
identified 103 unique sources (servers). But we also found some that did
not contain all of records that were available at the sources
themselves (e.g., there were only 24 preprints from SSRN, out of the
more than 700,000
preprints housed there today). In addition, although SHARE attempts to
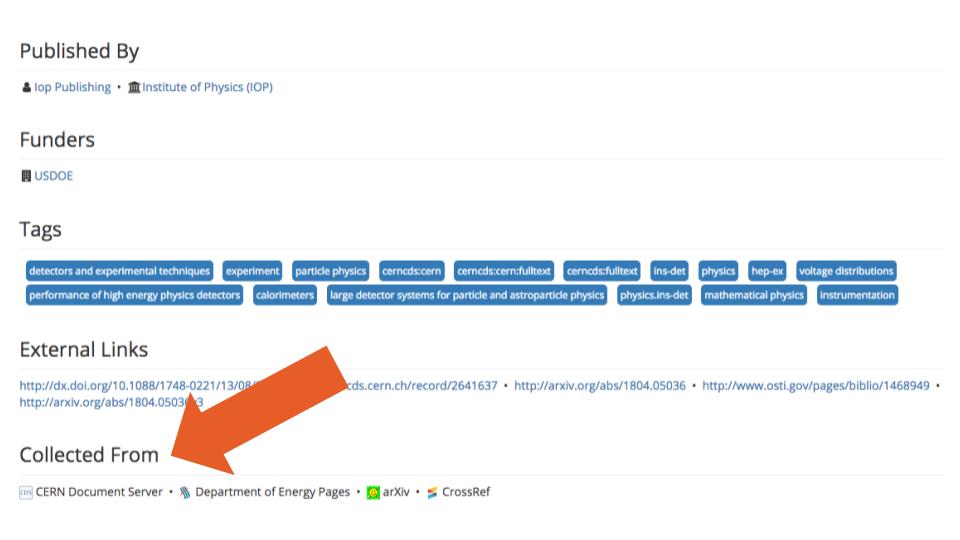
consolidate information from multiple sources for each record (e.g., see
Figure 1, below, for a record
with information available from four sources), we also found instances
where information from different records was consolidated as if it all
corresponded to the same record (e.g., example, where information on two different arXiv records—records one and two—was
merged, most likely due to the fact that both of these records link to
the same postprint publication). A clear description on how information
is harvested from each source could help researchers attempting to use
this data. Figure 1. SHARE aggregates preprint information from multiple sources
2) Subjects (i.e. scientific discipline or subdiscipline classification).
We were also unable to find documentation on how SHARE handles
subject/discipline classifications from various sources, nor on whether
there were plans to use a single classification system for all records.
We did confirm that, of the records that had a subject field value, 98% used the bepress classification of disciplines. However, this was only 1 of 21 different classifications we identified in the database.
Most records though, 1,517,874 (68%), did not have subject
information at all. We felt more could have been done to fill in the
subject classifications for these records. For example, records from the
RePEc preprint server—which deals exclusively with Economics—could be augmented under the subject Social and Behavioural Sciences, as
per their bepress classification, and similarly records from the
various arXiv repositories could be augmented based on their respective
fields.
3) Dates
Dates are a complicated metadata field, as research documents can be
time stamped at many different moments: when they are uploaded, when
their DOI was minted, when they were made public, updated, retracted,
etc. However, the SHARE metadata contains only two date fields for each record that are populated using the source’s
metadata (an additional three date fields exist for timestamps that
occur within the SHARE database itself). These two source-based dates
are: date_published (defined as: “date when the record was first published, issued, or made publicly available in any form”) and date_updated (defined as: “date when the record was last updated in the source”).
However, 2,085,123 (94%) of the records we examined didn’t have a date_published in SHARE, and only had the date_updated. This made it impossible to distinguish whether the date_updated referred
to the date that the record was first created, when its DOI was minted,
or when it was published in a printed or online version of a journal.
In other words, we couldn’t use this data to determine the elapsed time
between a preprint and its published paper (postprint), or to confirm
whether the record was a preprint at all (we’ll expand on this issue of
preprint/postprint identification in our next blog post). For
researchers and users who rely on this database, a clear indication of
which dates are harvested from each source would be greatly welcome.
4) Contributors
In the SHARE database, a Contributor is categorized as either a Creator (defined as: “the agent who authored or was a major contributor to the creation of the work”) or as a Contributor (defined
as: “the people or organizations responsible for making contributions
to an object”). In more scholarly familiar terms, Creators are authors and Contributors are uploaders, i.e. those who uploaded initial or revised versions of the preprints. Any Creator (author) or Contributor (uploader) is further classified as being either a person, institution, organization, or consortium.
This classification system poses several challenges. First, because any preprint record can have multiple Creators and multiple Contributors,
SHARE metadata cannot be used to determine who initially uploaded the
preprint (and filled the information on the authors, keywords, and other
preprint details). Instead, the metadata only offers information about
who can upload new versions. This, however, is a common issue in most
bibliographic databases; information on who initially submitted a
manuscript to a journal is seldom provided.
Second, information on the Contributors (uploaders) was
available for only 86,579 (4%) of records (most of which were preprints
hosted of the OSF preprint servers, arXiv or HAL). While it could be
assumed that the Contributors (uploaders) would most often also be Creators
(authors) of those records, we found—using a simple exact name
matching—that this occurred in only in 2,737 (3%) of the 86,579 records.
And just as we were initially confused by the two terms, we also found
examples where users uploading preprints might have misunderstood them
as well. Such is the case shown in Figure 2, where one person is listed
as a Creator (author) and five are listed as Contributors (uploaders), when in fact all six are authors. Figure 2. SHARE lists only one of six authors as the “Creator” of this preprintAffiliation information was almost non-existent for either
authors or uploaders. We found no affiliation information for 2,153,579
(97%) of records.
Even more problematic were records where the number of authors in the
metadata did not match the number of authors in the uploaded documents
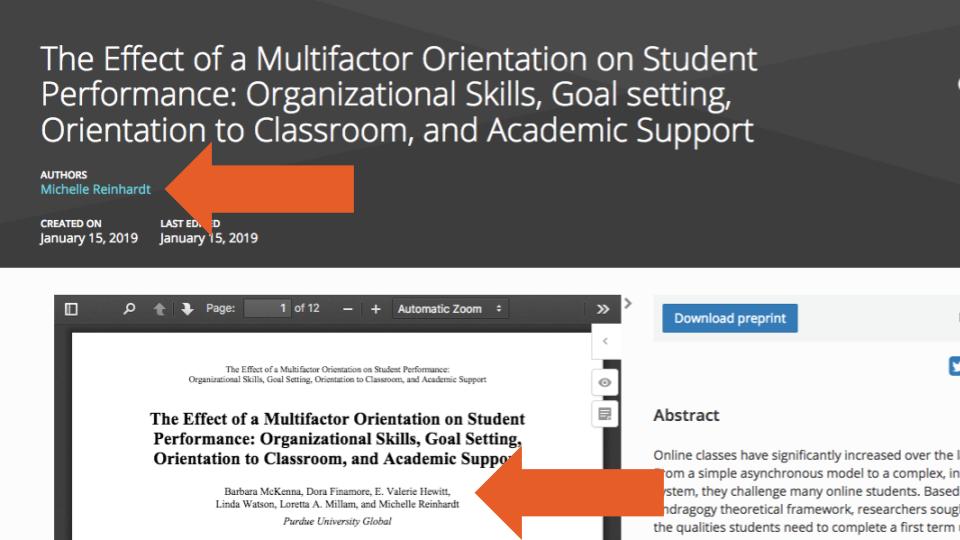
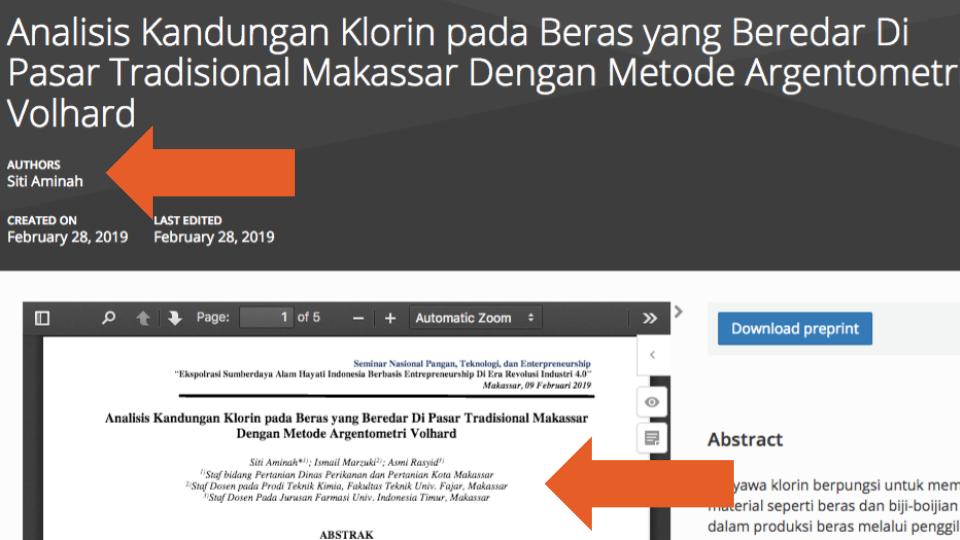
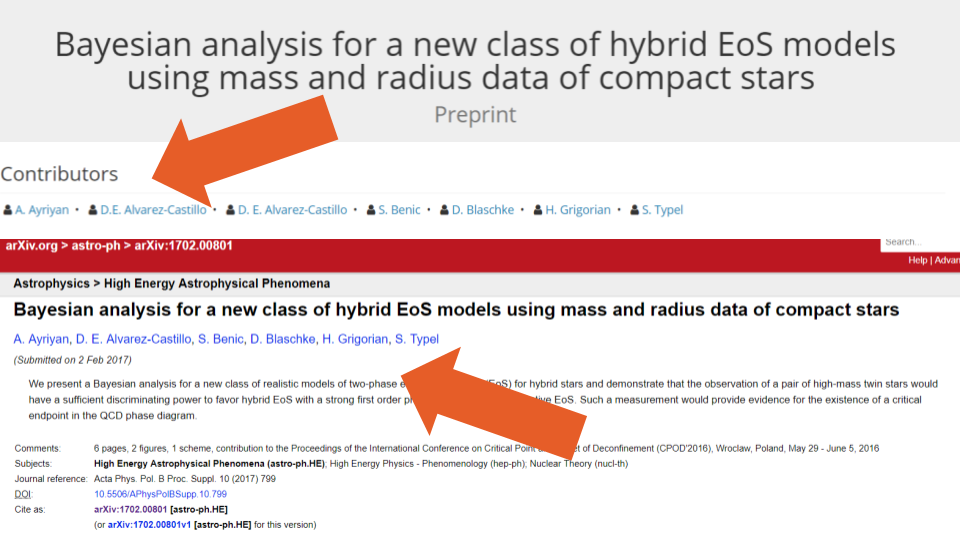
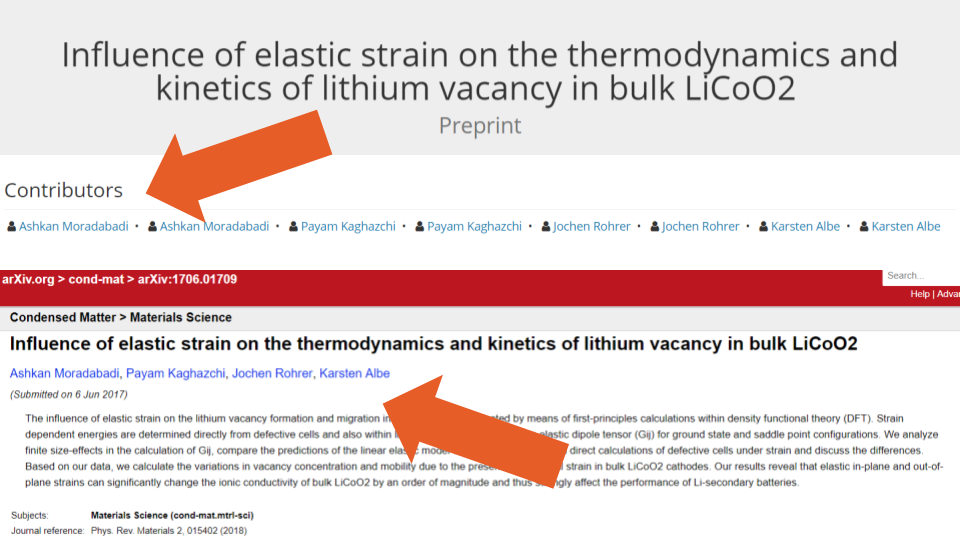
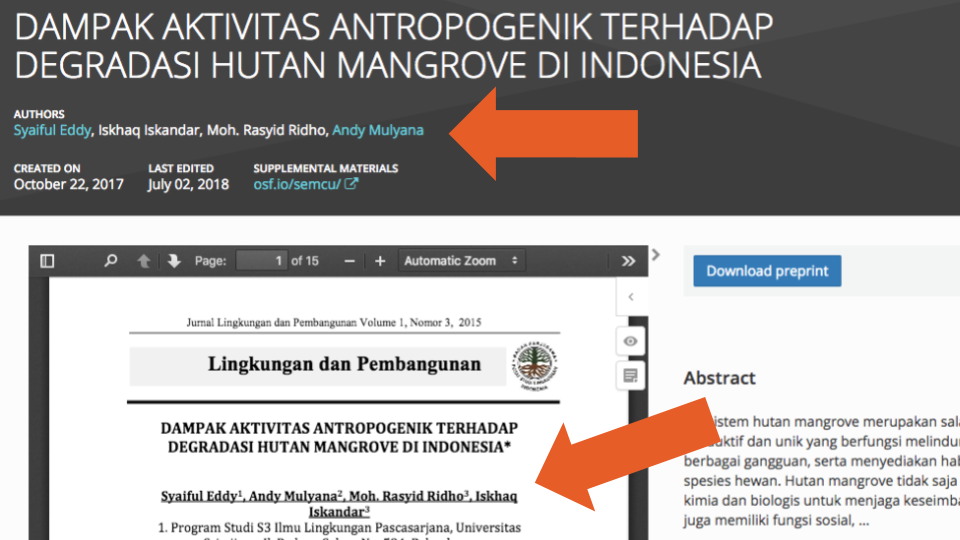
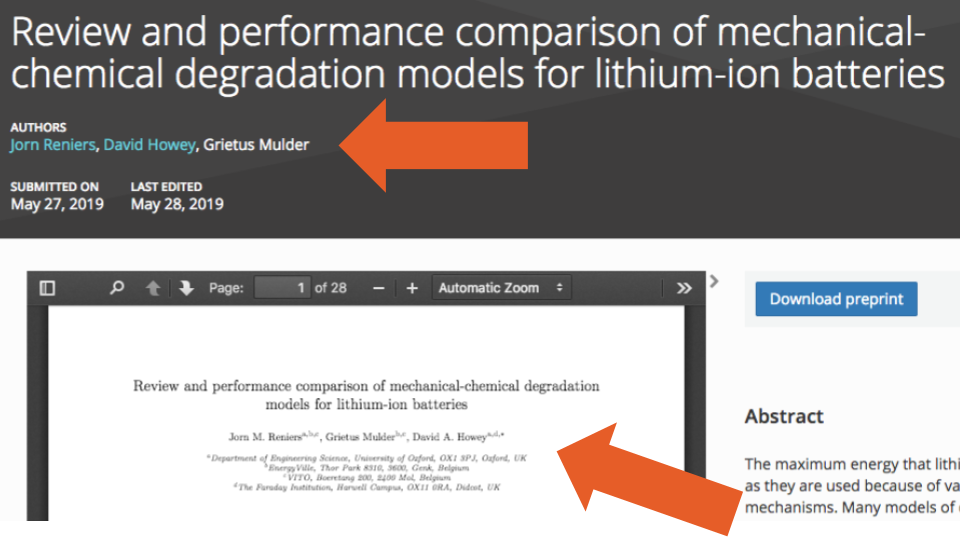
(e.g., this example lists one person as the only Creator and Contributor of the record, but the uploaded PDF has two additional authors, see below; and this example lists one Creator in the metadata, but three authors in the PDF—none of whom is the supposed Creator). Figure
3. We identified several records in which the contributor names in the
metadata did not match those in the uploaded documents
These errors make it very difficult to answer even the most basic
preprint authorship questions reliably: How many authors does a specific
preprint have? And what is the average (or median) number of authors
per preprint? These issues also constrain more detailed investigations
into authorship networks; author affiliations, countries or regions of
origin, seniority; and identifying all preprints published by a single
author.
“These
errors make it very difficult to answer even the most basic preprint
authorship questions reliably: How many authors does a specific preprint
have? And what is the average number of authors per preprint?”
Comparing the metadata of each record with the information in the
uploaded documents seems to be the only way to detect all of these
errors. Therefore, we can only presume (and hope) that the percentage of
records with an incorrect number of authors is small and will not
distort our analyses. Preprint servers, however, should apply better
methods or checks to ensure information on authors is correctly entered
into the metadata when preprints are submitted or posted.
Unfortunately, these were not the only issues that would make analysis of preprint authorship challenging. In SHARE, the byline order position (i.e. place in the list of authors) is provided in the metadata field order_cited for each author or Creator. We found that 454,866 (20%) of records assigned the same byline order position to several different Creators
(authors). To the best of our knowledge, these cases do not represent
instances where authors contributed equally to a paper or preprint.
Instead, they appear to be metadata errors.
One such error can be found for this preprint, where the metadata lists 4 authors—3 with the same byline order position—while the source’s website shows only two authors and the uploaded PDF only one. Other errors include listing all of the Creators (authors)
twice in the metadata (see Figure 4, where 4 authors are included in
the uploaded document and 8 in the metadata) and duplicating just one of
the names (see Figure 5, which lists 6 authors on the paper, but 7 in
the metadata). Figure 4. Eight authors are included in the metadata, but only four are in the original recordFigure 5. Seven authors are listed in the metadata, but only six in the preprint itself
We presume these errors most likely occur when the record information
is harvested from two different sources, and each source contains a
slight variation in the spelling of authors’ names or initials.
Additionally, even though we could not find documentation behind the order_cited for Contributors (uploaders), we found examples, as in case of this preprint, where the metadata listed the same byline order position for two uploaders.
To complicate things even further, we also found cases where the
byline order listed in the metadata did not match the order in the
posted PDF document (e.g., Figure 6 and Figure 7): Figure 6. The byline order position for the second and fourth authors in the uploaded document is reversed in the metadataFigure 7. The byline order position for the second and third authors in the uploaded document is reversed in the metadata
All these Contributor errors we detected mean that if
researchers rely solely on the SHARE metadata, any authorship analyses
they conduct will likely be very unreliable. We feel more work is needed
to improve the quality of authorship information during a creation of a
centralized database.
Still a long way to go
As can be seen from the many examples we describe above, even the
most basic metadata in SHARE is too problematic to provide a reliable
analysis on preprint uptake and use across life or other sciences. The
issues we encountered are further compounded by the lack of clear and
complete documentation about metadata fields, harvested sources, and the
way records from those sources are integrated into the SHARE database.
While we cannot attest to the value of SHARE as a service for preprint
discovery, we find that, in its current form, it cannot be considered a
valuable source for any rigorous analysis of preprints.
In the end, we decided to discard the SHARE database as a starting
point for our analyses, and we turned toward the original servers that
host that information. Stay tuned for the next post in our series, in which we’ll explore metadata from 24 OSF Preprint servers.
References
Fu DY, Hughey JJ. Releasing a preprint is associated with more attention and citations. bioRxiv. 2019:699652.
Chiarelli A, Johnson R, Pinfield S, Richens E. Preprints and
Scholarly Communication: Adoption, Practices, Drivers and Barriers
[version 1; peer review: 2 approved with reservations]. F1000Research. 2019;8(971).
Fraser N, Momeni F, Mayr P, Peters I. The effect of bioRxiv preprints on citations and altmetrics. bioRxiv. 2019:673665.
Serghiou S, Ioannidis JP. Altmetric Scores, Citations, and Publication of Studies Posted as Preprints. JAMA: The Journal of the American Medical Association. 2018;319(4):402-4.
Narock T, Goldstein EB. Quantifying the Growth of Preprint Services Hosted by the Center for Open Science. Publications. 2019;7(2):44.
Abdill RJ, Blekhman R. Meta-Research: Tracking the popularity and outcomes of all bioRxiv preprints. eLife. 2019;8:e45133.
Comments? Questions? Drop us a line on Twitter (tag
#scholcommlab). We have shared the issues outlined above with the COS
team, and welcome your insights and experiences with working with
preprint metadata. Our source code is available on GitHub.
Looking for some new person in the field of "Research Visibility and Impact", and "University Rankings" to follow. please reply if you'd like to connect with me as well.